Axis Properties
The Axis page for a selected standard axis provides a way to change the scale, set the length and starting position, set the axis limits, and create a title on a standard axis. The selected axis properties appear in the Property Manager. The Axis page for a box plot axis and stiff plot axis includes a limited set of the standard axis properties. The ternary plot axis is based on a standard axis, but uses different Limits properties.
|
|
|
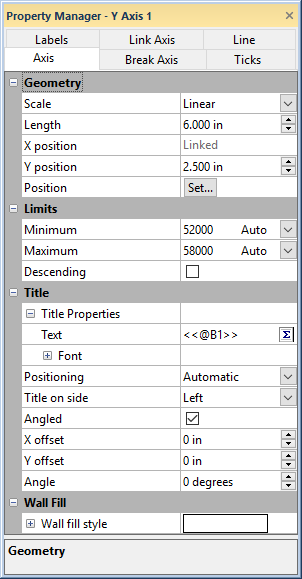
Edit the axis properties on the Axis tab in the Property Manager. |
Scale
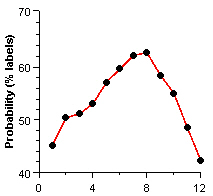
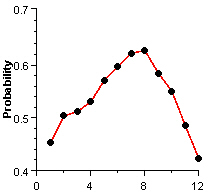
The axis scale can be Linear, Log (base 10), Probability, Probability (% labels), or Ln (natural log).
-
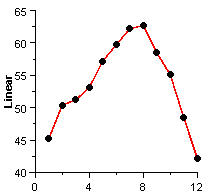
Linear axes default to a range that covers all of the data. Tick marks are spaced so that the tick mark labels do not overlap.
-
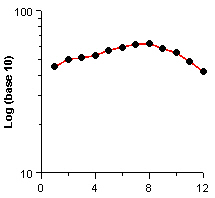
The data column used for a Log (base 10) axis should not contain values equal to or less than zero. If such values are present, the plot only displays values greater than zero. A warning message is displayed after selecting Log (base 10) if your data contains values less than 0.
-
Probability axis data must be percentages, though the axes can have percent (Probability (% labels)) or proportion labels (Probability). The data must be between 1E-5 (0.001%) and 0.99999 (99.9999%). All data values outside this range are excluded from the plot. The probability axis is a normal probability axis.
-
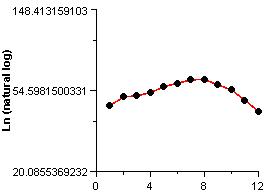
The Ln (natural log) option is similar to the Log (base 10) option, except a natural log is used.
-
The axis scale for a Box Plot Axis is Equidistant by default. Only grouped box plots with numeric categories and a single variable have the added axis scale options of a standard axis.
|
|
|
|
|
The Y Axis Scale is set toLinear. |
The Y Axis Scale is set to Ln (natural log). |
The Y Axis Scale is set to Log (base 10). |
|
|
|
|
The Y Axis Scale is set to Probability. |
The Y Axis Scale is set to Probability (% labels). |
When Link axis scale option on the Link Axis tab is checked for a dependent axis, the Scale option on the Axis tab displays Linked in the Property Manager. To change the Scale for the dependent axis, select the controlling axis and change the Scale.
Length
You can change the axis length by typing a new number into the Length box. The Length is in page units. The default length is 6.000 inches (15.24 cm) for 2D plots and 5.000 inches (12.7 cm) for 3D plots. Axes must be between 0.010 and 200 inches (0.0254 and 508 centimeters).
When Link length is checked for a dependent axis on the Link Axis tab, the Length option in the Axis Properties section on the Axis tab displays Linked in the Property Manager. To change the Length for the dependent axis, select the controlling axis and change the Length.
X Position
The X position option sets the horizontal position of the selected axis. The X position is in page units.
When Link X position is checked for a dependent axis on the Link Axis tab, the X position option in the Axis Properties section on the Axis tab displays Linked in the Property Manager. To change the X position for the dependent axis, select the controlling axis and change the X position.
Y Position
The Y position option sets the vertical position of the selected axis. The Y position is in page units.
When Link Y position is checked for a dependent axis on the Link Axis tab, the Y position option in the Axis Properties section on the Axis tab displays Linked in the Property Manager. To change the Y position for the dependent axis, select the controlling axis and change the Y position.
Position
Click the Set button next to the Position option to open the Position Axis dialog. The Position Axis dialog moves an axis relative to another axes.
Radius Axis Angle
For polar radius axes, the Axis angle option is used to set the angle at which the radius axis is to be drawn. Angles are in degrees. 90 degrees points to the right, 0 degrees points up.
Axis Limits
The Limits section controls
the axis range. Click the ![]() next to Limits to see the following options.
You can make the axis range smaller or larger by changing these settings.
If you make the axis range smaller, the plot can be drawn past the axes.
Clipping can be used to
limit the range of the plot.
next to Limits to see the following options.
You can make the axis range smaller or larger by changing these settings.
If you make the axis range smaller, the plot can be drawn past the axes.
Clipping can be used to
limit the range of the plot.
The axis minimum and maximum are displayed in the Minimum and Maximum fields. If Auto appears in the Minimum and Maximum fields, the axis range is automatically generated based on the data minimum and maximum. To limit the range of the axis, you can click the word Auto next to Minimum or Maximum and select Custom. You can then enter a new value into either the Minimum or Maximum box.
Click the word Custom and select Auto to go back to automatic axis limits. The word Auto will appear and the Minimum or Maximum will revert to the default value.
Logarithmic and probability axes cannot include values less than or equal to zero. The axis Minimum will revert back to the previous value if a value less than or equal to zero is typed in the Minimum field.
Axis Limits - Date/Time
If you have enabled date/time
formatting by selecting the Use
date/time format option on the Labels
page, the axis limits can be set with dates and time. Click the ![]() next
to Axis limits to see the following
options.
next
to Axis limits to see the following
options.
To set the limits based on dates and time, click the current date next to the Minimum date/time or Maximum date/time fields. In the Select Date/Time dialog, select the appropriate date and time. Click OK to make the change appear on the axis. Date values can also be typed directly in the box. When inputting date/time values directly in the Property Manager, date/times must always be entered as MM/dd/yyyy hh:mm:ss. No other formats are permitted in the date/time edit boxes in the Property Manager.
If an axis currently displays date and time formats, you can turn off date/time formats on the Labels tab by clearing the Use date/time format option.
Axis Limits and Plotted Data
If the axis limits are set completely outside the data range, the plot will be drawn outside the axes. For example, if the data range is 100 to 500, but the Minimum value is changed to 10,000 and the Maximum value is changed to 50,000 then it appears as if no plot is displayed and only axes are displayed. The plot is actually drawn well outside of the axes, whether it can be seen in the program window or not. Click the Fit to Window command to see the plot and the axes. If the data are plotted far beyond the axes, use the axis properties in the Property Manager to reset the axis limits or delete the plot in the Object Manager.
If the axis limits are completely inside the data range, the plot will extend beyond the axes by default. If you wish to plot only data that fall within the axis limits, select the plot and set the Clipping properties to Axis on the Data Limits page.
Linked Axis Limits
When Link limits is checked for a dependent axis, the Minimum and Maximum options in the Limits section on the Axis tab displays Linked in the Property Manager. To change the Minimum or Maximum for the dependent axis, select the controlling axis and change the Minimum or Maximum.
Ternary Axis Limits
The Limits properties section is different when the axis is part of a ternary or piper diagram
- The 0 to 100 scale check box changes the axis range from 0 - 1 to 0 - 100. Enabling this option for one axis automatically changes it for all three ternary diagram axes, all six Durov plot axes, or all ten piper diagram axes
- The Reverse direction option is available for ternary plots. Select Reverse direction to rotate the ternary axes.
- Ternary plots have two modes for setting the axis limits. Click Select in the Limits field to set the axis limits by clicking and dragging in the plot. Click Enter limits in the Advanced field to type the desired axis limits in the Axis Limits dialog.
See the Ternary Axis Tips topic for more information about ternary axes.
Stiff Plot Axis Limits
The Limits properties section behaves differently for a stiff plot. The axis Minimum is the negative value of the left side maximum, and the axis Maximum is the right side maximum. For example, a stiff plot axis Minimum of -80 sets the left side maximum to 80. The Minimum value must be less than 0.
Descending
The Descending option flips the axis so that it increases in the reverse direction. Check the box next to the Descending option to reverse the axis. If Descending is checked, the X Axis values decrease to the right, or the Y Axis values decrease upward. Descending axes are not available on ternary graphs.