Axis Properties - Break Axis Page
Linear, log base 10, and natural log scaled standard axes can be broken using the Break axis option in the Break Axis properties page. An axis break removes a selected portion of the axis from the view, replacing that section with an empty spot, or break, in the plot. Plots are also broken at the defined break axis value and continue on the other side of the axis break.
Important Note: Because of significant enhancements to this feature, some plots made in versions prior to Grapher 20 may not retain all prior functionality. For example, if you have a project that used Before tick spacing and Before tick division, these settings will no longer function in Grapher 20, because the tick before a break will take its properties from the parent axis. You can redefine the axis breaks using the new and enhanced features described below.
|
|
|
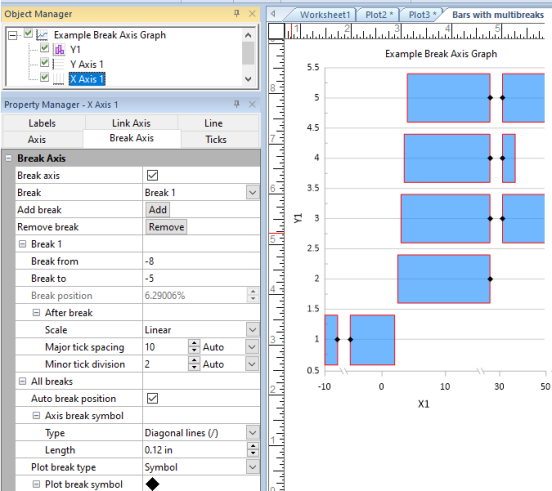
Set the location and appearance of the axis breaks on the Break Axis page (example shows two breaks). |
Note: You can set these as default properties through File | Defaults under the Break axis section of a selected axis type.
Break Axis
Check the Break axis box to define one or more breaks in the axis.
Note: If you linked an axis and selected to also link the tick position of the dependent axis to the controlling axis, selecting the Break axis property will disable the Link tick position property. See the Link Axis help topic for more information.
Individual Break Properties
Select the break you want to define from the Break list. To add a break, click the Add button, and to remove a break, first select the break you want to remove, and then click the Remove button.
Break From/To
Enter break boundaries into the Break from and Break to properties. These fields determine the range of values that are removed from the plot. The axis is broken between the Break from and Break to values, and no data in this range is displayed. The axis includes values from the axis minimum to the Break from value, a break occurs, and then proceeds from the Break to value to the axis maximum.
The Break from and Break to values must be within the data range for the plot(s) using the axis. If you enter a value outside this range, the value will automatically update to the min/max data value as appropriate.
Break Position
Enter a percent value in the Break position property to specify the location of the beginning of the break on the axis. For example, 50% would start the break in the middle of the axis. Depending on your data, this value may shift or extend certain parts of the axis. If you want Grapher to determine all break locations, check the Auto break position box to automatically space all breaks along the axis.
Break Range with Date/Time Formatting
If you have enabled date/time formatting, the axis break can be set with date and time values. To set the limits based on dates and time, set the date and time by clicking on the current date and time in the Break from date/time or Break to date/time fields, and set the limits in the Select Date/Time dialog. Alternatively, type the date value in the Break from date/time or Break to date/time field. These options only appear in the Property Manager when the axis uses date/time formatted data. You can also set the date/time break in numeric format in the Break from and Break to fields. If Break from date/time or Break to date/time are set, Break from and Break to change accordingly and vice versa. When inputting date/time values directly in the Property Manager, date/times must always be entered as MM/dd/yyyy hh:mm:ss. No other formats are permitted in the date/time edit boxes in the Property Manager.
Define the Axis After the Break
You can define the remaining part of the axis after the break, or you can accept the values generated by Grapher.
Scale
The axis scale can be Linear, Log (base 10), Ln (natural log), or Auto. See the Axis Properties help topic for examples of each scale.
Major Tick Spacing
Select Custom and then enter a value in the Major tick spacing property to set the value of the major tick spacing after the break. If Auto is selected, the Tick tab settings control this spacing.
Minor Tick Division
Select Custom and then enter a value in the Minor tick division property to set the minor tick division after the break. If Auto is checked, the Tick tab settings control the minor divisions.
All Breaks Properties
The following properties apply to all breaks on the axis.
Auto Break Position
Check the Auto break position box to have Grapher automatically space all breaks along the axis.
Axis Break Symbols
Different symbols can be selected to show the breaks in the axis.
Type
Select the type of axis break symbol in the Type list. Select None to display no symbols. Select Perpendicular lines (-), Diagonal lines (/), or Curved lines (~) to indicate the axis break with the selected symbol.
Length
Specify the length of the axis break marks in the Length property field.
Plot Break Symbols
Different symbols can be used to show the breaks in the plot data.
- Select None to not display a break symbol on the plot.
- Select Symbol to display a symbol at places where the plot is broken. The Plot break symbol section includes options for you to select symbol properties for the break symbol.
- Select Axis break mark to use the same symbols used for the axis break.
- Select Grid line to add grid lines before and after the break.