Property Manager
The Property Manager allows you to edit the properties of an object, such as a plot or axis. The Property Manager contains a list of all properties for a selected object. The Property Manager can be left open so that the properties of selected objects are always visible.
When the Property Manager is hidden or closed, double-clicking on an object in the Object Manager, or pressing ALT+ENTER, opens the Property Manager with the properties for the selected object displayed. To turn on the Property Manager, check the View | Display | Property Manager command.
For information on a specific feature or property that is shown in the Property Manager, refer to the help page for that feature. For instance, if you are interested in determining how to set the Symbol column for a line/scatter plot or how to change the Foreground color for a bar chart, refer to the specific pages for Symbol Properties or Fill Properties.
|
|
|
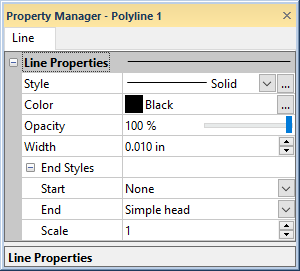
The Property Manager displays the properties associated with the selected object. |
Expand and Collapse Features
Sections with multiple properties appear with a plus  or minus
  to the left of the
name. To expand a section, click on the button.
To collapse a section, click on the icon. For example,
the expanded End Styles section
contains three properties: Start, End,
and Scale.
to the left of the
name. To expand a section, click on the button.
To collapse a section, click on the icon. For example,
the expanded End Styles section
contains three properties: Start, End,
and Scale.
Changing Properties
The Property Manager displays the properties for
selected objects. To change a property, click on the property's value
and type a new value, scroll to a new number using the ![]() buttons, select a new value using the
buttons, select a new value using the  slider, or select
a new value from the list or palette. For example, a polyline has Style, Color, Opacity, and Width properties and an End
Styles sub-section with Start,
End, and Scale properties.
Changing the Color requires clicking
on the current color and selecting a new color from the color
palette. Changing the Opacity
requires typing a new value or clicking on the slider bar and dragging
it left or right to a new value. Changing the Width
requires typing a new number or scrolling to a new number. Changing the
End requires clicking on the
existing style and clicking on a new style in the list.
slider, or select
a new value from the list or palette. For example, a polyline has Style, Color, Opacity, and Width properties and an End
Styles sub-section with Start,
End, and Scale properties.
Changing the Color requires clicking
on the current color and selecting a new color from the color
palette. Changing the Opacity
requires typing a new value or clicking on the slider bar and dragging
it left or right to a new value. Changing the Width
requires typing a new number or scrolling to a new number. Changing the
End requires clicking on the
existing style and clicking on a new style in the list.
The selections in the Property Manager control which properties are displayed. Properties are hidden when they do not have an effect on the object. For example, when the Gradient is set to None on the Fill page, the Colormap and Fill orientation properties are hidden. When the Gradient is changed to Linear, the Colormap and Fill orientation properties are displayed, while the Pattern, Foreground color, and Foreground opacity properties are hidden.
You can modify more than one object at a time. For example, click on X Axis 1 in the Object Manager, and then hold the CTRL key and click Y Axis 1. You can change the properties of each axis simultaneously in the Property Manager. Only shared properties may be edited when multiple objects are selected. For example, only the line properties are displayed when both a polyline and polygon are selected. You can edit multiple plots of the same type at one time. However, no properties are displayed when the selected plots are different plot types.
Applying Property Manager Changes
Object properties automatically update after you select an item from
a palette, press ENTER, or click outside the property field. When using
the ![]() buttons or slider, changes are displayed on
the graph immediately.
buttons or slider, changes are displayed on
the graph immediately.
Keyboard Commands
Press ALT+ENTER to access the Property Manager. Pressing ALT+ENTER will also show the Property Manager if it is hidden or pinned. When working with the Property Manager, the up and down arrow keys move up and down in the Property Manager list. The TAB key activates the highlighted property. The right arrow key expands collapsed sections, e.g., Plot Properties, and the left arrow collapses the section.
CTRL+A can be used to select all of the contents of a highlighted option, such as the function plot's Y = F(X) = equation. CTRL+C can be used to copy the selected option text. CTRL+V can be used to paste the clipboard contents into the active option.
Property Defaults
Use the File | Options command to change the default rulers and grid settings, digitize format, line, fill, symbol, and font properties. Use the File | Defaults command to set the default values for base objects, graphs, line type plots, bar type plots, 3D XYY plots, 3D XYZ plots, maps, other plots, axes, legend, wind chart legends, and class plot legends.
Property Manager Information Area
If the Display Property Manager info area is checked on the File | Options | Display page, a short help statement for each selected command in the Property Manager.