File | Defaults
Click the File | Defaults command to change the default properties for basic objects, graphs, plots, axes, and legends. Changing these default properties makes the change only for the selected object type. Once the defaults have been changed, all new objects created from the ribbon commands will have those attributes. For example, if you change the line color to red for an ellipse object, all future ellipse objects will have the red line color by default. Existing objects will not be changed. However, if you create new plots from the Create command in the Plot page of the Property Manager, subsequent plots will be colored by the Plot palette option.
Default settings for graphing objects can also be set through template graphs. Grapher program options can be controlled with the File | Options command.
Defaults Dialog
Use the File | Defaults command to open the Defaults dialog.
|
|
|
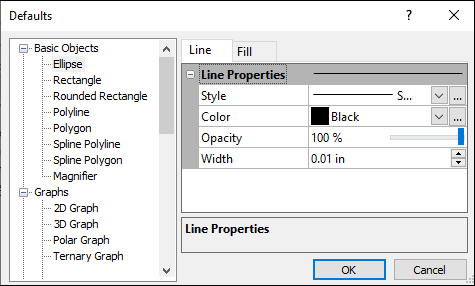
Use the Defaults dialog to specify Grapher default options. |
Expanding Options
Left-click the ![]() button
to the left of an option to expand the detailed options.
button
to the left of an option to expand the detailed options.
Condensing Options
Left-click the  button
to the left of an option to condense the detailed options.
button
to the left of an option to condense the detailed options.
Left Side - Default Categories
The default settings for Basic Objects, Graphs, Line Type Plots, Bar Type Plots, Polar Type Plots, 3D XYY Plots, 3D XYZ Plots, Maps, Other Plots, Axes, Legend, Wind Chart Legend, and Class Scatter Plot Legend can be accessed on the left side of the dialog. Left-click on an item to display the current settings on the right side of the dialog.
| Left-side Category | Contains: |
| Basic Objects | Ellipse, Rectangle, Rounded Rectangle, Polyline, Polygon, Spline Polyline, Spline Polygon, and Magnifier |
| Graphs | 2D Graph, 3D Graph, Polar Graph, Ternary Graph, and Radar Graph |
| Line Type Plots | Line/Scatter Plot, Class Scatter Plot, Function Plot, Step Plot, Math Plot, Fit Plot, and Confidence Plot |
| Bar Type Plots | Bar Chart, Floating Bar, and Histogram |
| Polar Type Plots | Polar Line/Scatter Plot, Polar Vector Plot, Polar Class Scatter Plot, Polar Bar Chart, Polar Function Plot, Polar Rose Diagram, and Polar Wind Chart |
| 3D Plots | 3D Bar Chart, 3D Floating Bar, 3D Function Plot, 3D Histogram, 3D Ribbon Plot, and 3D Step Plot |
| XYZ Plots | XYZ Line/Scatter Plot, XYZ Class Scatter Plot, XYZ Bar Chart, XYZ Floating Bar Chart ,XYZ Bubble Plot and XYZ Vector Plot |
| Maps | XY Contour Data Map, XZ Contour Data Map, XY Contour Grid Map, XZ Contour Grid Map, XY Contour Function Map, XZ Contour Function Map, Surface Data Map, Surface Grid Map, Surface Function Map, Color Scale, and Surface Color Scale |
| Other Plots | Box Plot, Q-Q Plot, Bubble Plot, Hi-Low-Close Plot, Pie Chart, 3D Pie Chart, Doughnut Plot, 3D Doughnut Plot, Stiff Plot, Ternary Line/Scatter Plot, Ternary Class Scatter Plot, Vector Plot, and Radar Plot |
| Axes | X Axis, Y Axis, 3D X Axis, 3D Y Axis, 3D Z Axis, Polar Radius Axis, Polar Angle Axis, Ternary X Axis, Ternary Y Axis, Ternary Z Axis, Box Plot Axis, Stiff Plot Axis, and Radar Graph Axis |
| Legend | Options for default legend properties. An empty string can be set for the default legend title. When set to no text, no title is displayed when a legend is created. The default legend title is Legend. You can set options for linking legend titles, entries, legend font properties, etc. To automatically use the graph name for the legend title, set the Legend title default text to <<Graph Name>>. This will display the linked graph name as the legend title for most legends. This will display <<Graph Name>> as the default title for multi-graph legends, as these are not linked to a single graph |
| Wind Chart Legend | Options for default wind chart legend properties. An empty string can be set for the default graph title. When set to no text, no title is displayed when a legend is created. The default legend title is Legend. You can set options for linking legend titles, entries, legend font properties, etc. To automatically use the graph name for the legend title, set the Legend title default text to <<Graph Name>>. This will display the linked graph name as the legend title for wind chart legends. |
| Class Plot Legend | Options for default class plot legend properties. An empty string can be set for the default graph title. When set to no text, no title is displayed when a legend is created. The default legend title is Legend. You can set options for linking legend titles, entries, legend font properties, etc. To automatically use the graph name for the legend title, set the Legend title default text to <<Graph Name>>. This will display the linked graph name as the legend title for class plot legends. |
Right Side - Default Properties
The current settings for the selected item are displayed on the right side of the dialog. The appropriate tabs are displayed (i.e., Line or Fill) with the appropriate options for the selected object type. Make any appropriate changes and click the OK button.
Reset
Select a default category and click the Reset button to restore an object to its base default settings.