Fill Properties
Fill properties can be changed for selected objects. To edit the fill properties, click on the object in the Object Manager or plot window. The properties are listed in the Property Manager on the Fill tab.
The Fill page in the Property Manager contains properties for all fills in the object. For example, a 3D ribbon/wall plot Fill page will include a Ribbon Fill Properties section for the ribbon fill, an Error Bar Fill Properties section for the error bar fill, and a Wall Fill Properties section for the wall fill.
|
|
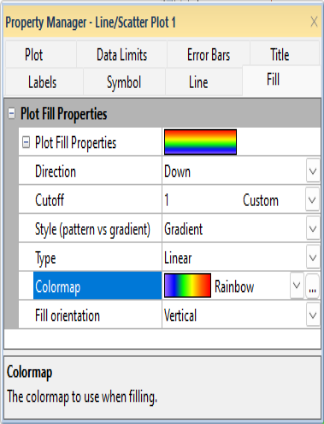
The fill properties are set in the Property Manager on the Fill tab. |
Color Method
-
Uniform Color: Applies a single, solid foreground pattern and color consistently across all elements in the selected plot.
-
Numeric via colormap: Maps a continuous range of numerical values from a designated worksheet data column to a color gradient colormap, dynamically coloring individual plot elements based on their numeric values. When this method is selected, an additional Pattern section is available to set fill patterns across the mapped colors.
-
Explicit color names: Reads color name strings or formatting codes directly from a designated worksheet column (such as "Red", "RGB(255,0,0)", or "R255 G0 B0") to assign unique fill colors to individual elements. When this method is selected, an additional Pattern section is available to set fill patterns. Note: This option is not available for 2D or 3D Histograms.
-
Defined color table: Uses a custom color table to assign specific colors and fill patterns to plot elements based on indexing or defined data ranges.
-
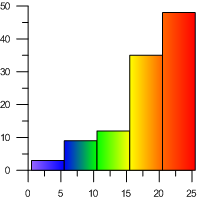
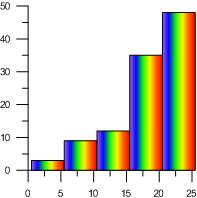
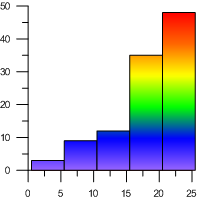
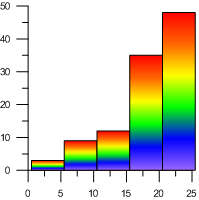
Spread across plot: Fills across the entire extent of the plot using a color gradient rather than on an individual bar basis. This option is available for 2D/3D bar charts, 2D/3D floating bar charts, and 2D/3D histograms. Note: This option is not available for XYZ bar charts or XYZ floating bar charts. To achieve a similar gradient spread on XYZ plots, select Numeric via colormap and choose the X, Y, or Z data column.
 Spread across plot examples
|
|
|
|
This example has Spread across plot option checked with Horizontal as the Fill orientation. |
This example has Spread across plot option cleared with Horizontal as the Fill orientation. Each bar is individually filled with the gradient. |
|
|
|
|
This example has Spread across plot option checked with Vertical as the Fill orientation. |
This example has Spread across plot option cleared with Vertical as the Fill orientation. The bars are individually filled with the gradient. |
|
Color Method |
2D/3D Bar |
XYZ Bar |
2D/3D Floating Bar |
XYZ Floating Bar |
Polar Bar |
2D/3D Histogram |
Bubble Plot |
Box Plot |
|---|---|---|---|---|---|---|---|---|
|
Uniform Color |
✅ |
✅ |
✅ |
✅ |
✅ |
✅ |
✅ |
✅ |
|
Numeric via colormap |
✅ |
✅ |
✅ |
✅ |
✅ |
✅ |
✅ |
✅ |
|
Explicit color names |
✅ |
✅ |
✅ |
✅ |
✅ |
❌ |
✅ |
✅ |
|
Defined color table |
✅ |
✅ |
✅ |
✅ |
✅ |
✅ |
✅ |
✅ |
|
Spread across plot |
✅ |
❌ |
✅ |
❌ |
❌ |
✅ |
❌ |
❌ |
Unassigned Fill Properties
The Unassigned Fill Properties section provides fallback fill settings for plot elements when the active Color Method cannot determine a color due to missing or invalid data. These "catch-all" properties apply pattern, color, and opacity settings to elements in scenarios such as:
-
Numeric via colormap: Worksheet cells containing "N/A", empty text, or null values in the assigned numeric column.
-
Explicit color names: Worksheet cells with missing entries, blank rows, or unrecognized color name strings.
-
Defined color table: Plot values or categories that fall outside the defined ranges or entries in the color table.
Edit the fallback Pattern, Foreground Color, Foreground Opacity, Background Color, and Background Opacity within this section to control how unassigned or missing points appear on the plot.
Fill Properties - Sample
The sample shown next to the Fill Properties field shows the selected pattern, foreground color, and background color.
Direction
You can fill the plot in one of four directions by selecting one of the following from the Direction list. Down fills the area under the curve to the minimum Y Cutoff value. Up fills the area above the curve to the maximum Y Cutoff value. Left fills the area to the left of the curve to the minimum X Cutoff value. Right fills the area to the right of the curve to the maximum X Cutoff value.
When a Between Fill plot is used, the Direction options allow you to specify Horizontal or Vertical.
Cutoff
The Cutoff value controls the limits of the fill. To return the Cutoff to the default value, click the word Custom and it will return to Auto. When the Cutoff is set to Auto, the value is the minimum or maximum axis value.
For example, if Up is the selected Direction and the Cutoff is set to Auto, the fill will go to the Y axis maximum value. If > 20 is entered as the Cutoff, the fill is above the curve to the Y Axis value of 20. Any area above the curve that is greater than the Y Axis value of 20 is not filled.
Style
The Style property specifies the fill rendering mode applied to each individual fill point rather than across all points in the plot. Select Pattern or Gradient from the Style list:
-
Pattern: Fills each individual fill point using the selected stock pattern lines or an imported bitmap texture image.
-
Gradient: Fills each individual fill point with a smooth color gradient transition using the assigned colormap.
Pattern
The Pattern indicates the way that an object is filled. In the list, select a new pattern from the fill palette. There are two types of fill patterns: Windows stock and bitmap images. Stock patterns and some bitmap patterns can have different foreground and background colors. All patterns can have the foreground or background color partially transparent.
Bitmap patterns can be scaled. Bitmap patterns are not available for contour maps or surface maps. Click the  to the right of the Pattern to import an image to use as a bitmap fill. For bar charts, you may wish to use the Image bar Bar style rather than a bitmap fill.
Foreground Color
The Foreground color is the color of the pattern lines or pixels. Click the existing color sample next to Foreground color to open the color palette. Click on a color in the palette to use it for the selected foreground fill color. Click the button to the right of the color sample to open the Colors dialog, setting a custom color.
Foreground Opacity
The Foreground opacity controls the transparency of the foreground portion of the pattern. Opacity values are between 0% (zero opacity, full transparency) to 100% (full opacity, zero transparency).
Background Color
The Background color is the color behind the pattern. All patterns must have a background color. If you do not wish to see the background color, change the Background opacity to 0%. Click the existing color sample next to Background color to open the color palette. Click on a color in the palette to use it for the selected foreground fill color. Click the button to the right of the color sample to open the Colors dialog, setting a custom color.
Background Opacity
The Background opacity controls the transparency of the background portion of the pattern. Opacity values are between 0% (zero opacity, full transparency) to 100% (full opacity, zero transparency). To make a fill pattern appear transparent with only the foreground portion of the fill pattern showing, change the Background opacity value to 0%.
Stretch
Check the Stretch option to stretch image fills to completely fill the geometry. If Stretch is not selected, the image will be repeated to fill the geometry.
Scale
The Scale controls the density of the bitmap fill Pattern. Clear the box next to the Stretch option and set the Scale factor to a value between 0.1 and 10. The larger the Scale, the larger the resulting pattern.
Gradient
The Gradient section sets the fill pattern to a gradient fill.
Gradient Type
The Type controls whether a gradient fill pattern is used to fill the selected area. Select None, Linear, or Radial for the Type. When the Type is set to None, the gradient fill options are disabled. The fill is determined by the Pattern, Foreground, and Background options. When the Type is set to Linear, a linear color gradient fills the area. The colors change in a linear manner from the top to the bottom or from the left to the right of the area. When the Type is set to Radial, a radial color gradient fills the area. The colors change in concentric circles, either expanding from the interior and going out or from the exterior and going in. Some 3D objects, such as 3D bar charts, do not support Radial gradient fill.
|
|
|
|
|
This example has Type set to None. |
This example has Type set to Linear. |
This example has Type set to Radial. |
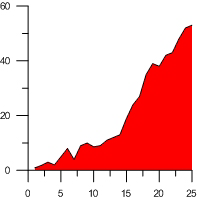
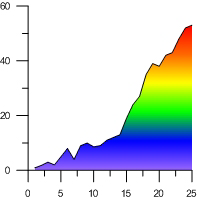
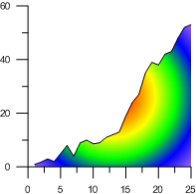
Colormap
The Colormap option fills the graph components with a color gradient. Click the existing color gradient and select the desired predefined gradient from the list. Click the button to the right of the color gradient to open the Color Gradient dialog. This option is disabled if the Type is set to None.
Fill Orientation
The Fill orientation option sets the direction the gradient fills. When the Type is set to Linear, choose either Vertical or Horizontal for the Fill orientation. The Vertical option sets the gradient to change along the Y axis. The Horizontal option sets the gradient to change along the X axis. When Radial is selected as the Type, the Fill orientation options are Inward and Outward. This reverses the color direction. The Fill orientation option is not available when the Type is set to None.
The color gradient can be mapped to plot values when the Fill orientation is set to Linear. However, the Data to Color Mapping section of the Color Gradient dialog is not available when the Fill orientation is set to Radial.
Explicit Color Names
The Color variable option is available to 2D bar charts, floating bar charts, histograms, polar bar charts, box-whisker plots, bubble plots, 3D XYY bar charts, floating bar charts, histograms, 3D XYZ bar charts, and floating bar charts. The Color variable option allows you to select colors from a specific column in the worksheet to use as the Foreground color. Each bar is colored from the designated worksheet column or row. If a worksheet cell does not have a color specified, the Foreground color is used for that bar.
Colors can be specified in the worksheet by many different methods. The table below provides some examples, where <r>, <g>, <b>, and <a> are red, green, blue, and alpha values between 0 - 255, and <color> is a predefined color name as it appears in the color palette. An alpha value of 0 is fully transparent and 255 is fully opaque.
| Method | Example |
| <color> | Red |
| <color>:<a> | Red:255 |
| RGB(<r>,<g>,<b>) | RGB(255,0,0) |
| RGB(<r>,<g>,<b>,<a>) | RGB(255,0,0,128) |
| \COLOR(<r>,<g>,<b>,<a>) | \COLOR(255,0,0,255) |
| R<r> G<g> B<b> | R255 G0 B0 |
| R<r> G<g> B<b> A<a> | R255 G0 B0 A255 |
| \RGBR<r> \RGBG<g> \RGBB<b> | \RGBR255 \RGBG0 \RGBB0 |
| \RGBR<r> \RGBG<g> \RGBB<b> \RGBA<a> | \RGBR255 \RGBG0 \RGBB0 \RGBA180 |
Use Color Table
Check the box next to Use color table to specify the bar chart bar color from a color table. The Color table option becomes active. Uncheck the box next to Use color table to turn off the color table functionality. A color table can allow each bar to use a separate color and fill property or a repeating color and fill property. The Color Table dialog allows you to assign a color to each bar in the chart.
Color Table
Click the Set button next to Color table to open the Color Table dialog and control which colors are used in the graph.
Show Color Table Legend
All available legends including Color Table Legend for the selected plot are created and automatically arranged outside the graph area using the Graph Tools | Add to Graph | Plot Legend command.
To add a legend to your plot:
- Select the target plot in the plot window or Object Manager.
- Click the Graph Tools | Add to Graph | Plot Legend command.
See the Plot Legend page for more details on naming conventions, positioning, and additional properties. For grouped box plots, the name of each color table entry in the legend will be associated with a Variable or Category.
Box Plot Color Method
The Color method field determines how each color table entry is applied to a grouped box plot.
Select Color by box to make every box use a different color in the color table.
Select Color by category to color the boxes in the plot based on the assigned category in the worksheet. If the data is grouped by category, this will result in groups of boxes that are all the same color. If the data is grouped by variable, each box in a group will be a different color.
Select Color by variable to color the boxes in the plot based on the assigned variable in the worksheet. If the data is grouped by variable, this will result in groups of boxes that are all the same color. If the data is grouped by category, each box in a group will be a different color.
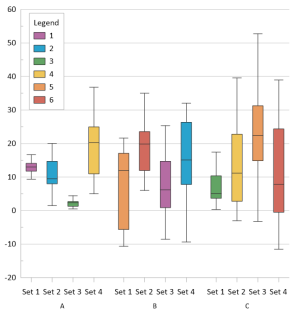
|
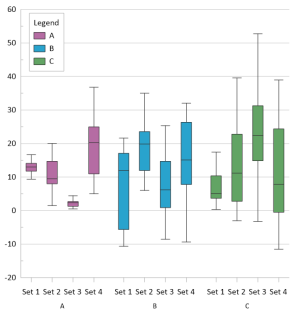
|
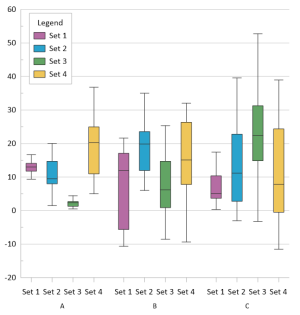
|
| Grouped box plot with data grouped by category and colored by box | Grouped box plot with data grouped by category and colored by category | Grouped box plot with data grouped by category and colored by variable |
Different Fill for Bars
Select the Different fill if bars<base to add a second Fill Properties section. The Fill Properties (bars>base) section controls the fill colors for the bars that extend up from the base value. The Fill Properties (bars<base) section controls the fill colors for the bars that extend down from the base value.
Use Plot Line Color for Ribbon Fill
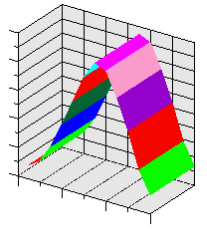
For 3D XYY ribbon/wall plots, when a Color variable is specified in the Plot Line Properties, the Use plot line color for ribbon fill option is available. The ribbon uses the same color as the Color variable when the Use plot line color for ribbon fill option is checked.
|
|
The ribbon segments are filled with the same color as the line segments. |