Tick Labels
Customize the major and minor tick labels in the axis properties Labels page. The selected axis properties appear in the Property Manager. The General section includes properties for defining which labels appear and the source for the label values. The General section properties apply to both major and minor labels. The Label Settings section includes properties for the appearance of the labels, including font, format, background, and position. The Label Settings section properties can be set independently for major and minor tick labels. Tick mark labels can be positioned with the Label Position properties or manually moved with the Move Labels command.
|
|
|
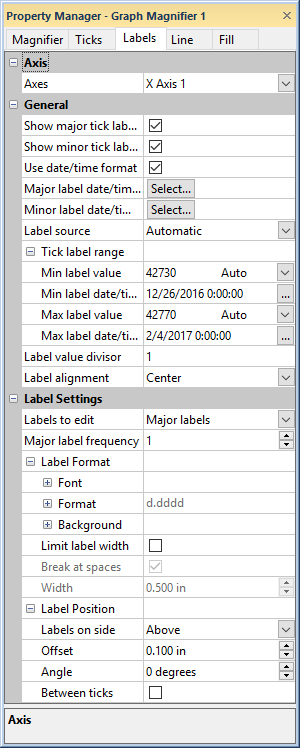
Set major and minor tick labels on the Tick Labels tab in the Property Manager. |
Axes
For a graph magnifier, the Axes option sets the axis for which the tick labels are being set. To change the axis, click on the current axis name and select the desired axis from the list.
General
The General section includes properties for defining which labels appear and the source for the label values. The General section properties apply to both major and minor labels.
Show Labels
Select the Show major tick labels option to turn on major tick labels. Select the Show minor tick labels option to turn on minor tick labels. Minor labels cannot be displayed with probability axes.
Date/Time Formatting
If the data being plotted is in date/time format in the worksheet, select the Use date/time format option. The labels will be displayed in a date/time format. The labels appear as numbers when the Use date/time format option is cleared.
-
If you have date/time data, set the Label source to Automatic and select the Use date/time format option to use date/time formatting for the tick labels.
-
If you have unevenly spaced text date/time data, you can use From worksheet as the Label source. This allows you to set up the major tick mark locations and the labels that correspond with the tick marks.
-
If you have evenly spaced numeric data and an evenly spaced time increment, you can use Numeric date/time as the Label source. This converts numeric data to date/time by specifying a date/time that corresponds to one of the numeric values and the date/time increment that corresponds to the change in the numeric values.
-
When changing the X column, Y column, or Z column on the Plot tab to a date/time column from a numeric column, the Use date/time format option is automatically selected to match the new data. When changing the X column, Y column, or Z column on the Plot tab to a numeric column from a date/time column, the Use date/time format option is automatically cleared to match the new data.
-
If your axis is displaying date/time labels and should not use date/time formatting, clear the Use date/time format checkbox.
The Use date/time format option is automatically selected when an axis is used by only one plot and the plot's data column includes date/time values. If the axis is used by multiple plots, or if the data column isn't changed, the Use date/time format option will not be automatically updated.
Major and Minor Label Date/Time Format
When the Use date/time format option is selected, the Major label date/time format and Minor label date/time format properties are available. Click Select to specify the date/time format for the labels in the Date/Time Format Builder dialog. The major and minor label date/time formats are specified independently. For example, the major tick labels can display month and year while the minor tick labels display only month.
Label Source
The Label source defines which values are used for the tick labels. There are three Label source options: Automatic, Numeric date/time, and From worksheet. To change the Label source, click on the current option and select the desired option in the list.
-
Automatic creates numeric or date/time labels that are based on the axis minimum and axis maximum. Automatic labels update automatically when the axis limits change.
-
Numeric date/time converts numeric values to date/time labels. Use this option ONLY if the data are numeric and organized in evenly spaced increments of time. This option is used when the data are numeric but represent date/time information. Click Set in the Date/time settings field to tell Grapher what numeric value corresponds to a specific date/time. This option is not often used, but it can be useful if you have data that is collected in time intervals and you wish to convert it to specific dates and times.
-
From worksheet lets you read labels directly from a data column. Select a Worksheet, Data column, Label column, and Worksheet rows to use worksheet labels. This option lets the axis display text or numbers for the tick labels and lets you specify the major tick mark locations.
Date/Time Settings
When the Label source is set to Numeric date/time, numbers can be assigned a date. This can be useful when you have only numbers in your worksheet and a numeric increment is equal to a time increment. After setting the Label source to Numeric date/time, click the Set button next to the Date/time settings option to open the Date/Time Labels dialog. Note that this option is not used when the data in the worksheet is already formatted as dates and times.
Worksheet Labels
When the Label source is set to From worksheet, axis data values can be associated with different numbers or text to be displayed as the label on the axis. This can be useful for labeling groups. After setting the Label source to From worksheet, the Worksheet, Data in rows, Data column, Label column, and Worksheet rows can be set. See the Worksheet Labels topic for examples.
When labels are defined from a worksheet, a worksheet must be created that contains the axis values in one column and the label values or text in another column. Specify the worksheet next to the Worksheet option. To select or change the worksheet, click the word None next to the Worksheet field to select the worksheet containing the label information. A list appears from which you can select an existing worksheet. Alternatively, you can choose the Browse option to open the Open Worksheet dialog and select a different worksheet file. Click the Open button to exit the Open Worksheet dialog.
Data in Rows
Select the Data in rows option if your data file is formatted where each row includes one variable. When the Data in rows option is selected, all plot properties that require data values are specified by selecting a data row. This includes variables such as X and Y, data labels, worksheet ranges, etc. Properties that list column letters will update to list row numbers. When switching from plotting data in columns to plotting data in rows, Grapher may not be able to select the correct rows automatically. Verify the correct rows are selected.
The property descriptions below refer to data columns, but when Data in rows is selected the property lists will include rows.
NOTE: The worksheet columns are retained after changing the worksheet. If the Data column or Label column is blank after changing the Worksheet, click on the blank option and select the desired column. A blank next to either Data column or Label column means that the column does not exist in the new worksheet.
Data and Label Columns
The Data column is the worksheet column that contains the actual axis values that should contain a label. These values are in axis units. The Label column is the worksheet column that contains the number or text to be displayed as the axis label. The Data column and Label column options contain a list of all the columns in the selected worksheet. Click on the column name next to the Data column and Label column fields to change the columns used to label the axis. In the list that appears, select the new column. If the first worksheet row contains header information, the header information appears next to the column letter.
Aside from the columns containing data there are two other options available for Data column: row number and sequence number. These options are available in the list that appears before the first column.
-
Selecting the Row number option plots the data value on the axis with the row number. For example, if the first row is number two, the axis value is two.
-
The Sequence number option plots the data value on the axis according to the total number of rows used. The sequence number always begins with the number one regardless of which rows are selected in the Worksheet rows section. Blank lines between rows are ignored when calculating the value. The sequence number increments by one when rows are adjacent or when rows are skipped.
NOTE: The worksheet columns are retained after changing the worksheet. If the Data column or Label column is blank after changing the Worksheet, click on the blank option and select the desired column. A blank next to either Data column or Label column means that the column does not exist in the new worksheet.
Worksheet Rows
Select the range of rows to plot in the Worksheet
rows section. Click the ![]() next to Worksheet rows to open the Worksheet rows section. The default
rows are the first and last rows in the worksheet that contain data.
next to Worksheet rows to open the Worksheet rows section. The default
rows are the first and last rows in the worksheet that contain data.
If Auto is selected for the First row and Last row, all of the rows containing data are used for the tick labels. To limit the rows, next to First row or Last row, click the word Auto. It will change to Custom. You can then enter a new row number into either the First row or Last row box. Click the word Custom to go back to automatic row selection. The word Auto will appear and the First row or Last row will revert to the default row.
Tick Label Range
The Tick label range section
controls the minimum and maximum tick mark value that should contain a
label. Click the  next
to Tick label range to open the
section. The Min label value is
the first value on the axis that should contain a tick label. The Max label value is the last value
on the axis that should contain a tick label. All tick marks before the
Min label value or after the
Max label value do not display
tick labels. These values are in axis units.
next
to Tick label range to open the
section. The Min label value is
the first value on the axis that should contain a tick label. The Max label value is the last value
on the axis that should contain a tick label. All tick marks before the
Min label value or after the
Max label value do not display
tick labels. These values are in axis units.
The axis minimum and maximum are displayed in the Min label value and Max label value fields, by default. If Auto appears, the tick label range is automatically generated based on the axis minimum and maximum. To limit the range, you can click the word Auto next to Min label value or Max label value and select Custom. You can then enter a new value into either the Min label value or Max label value box. The word Auto will appear and the Minimum or Maximum will revert to the default value.
Stiff Plot Axis Tick Label Range
The Tick label range values for a stiff plot axis specifies which labels will display for both the left and right sides of the stiff plot axis. The Min label value must be greater than or equal to 0. In the following image for example, the Min label value = 1 and the Max label value = 3. Labels are not displayed for the 0 tick mark in the center or for the tick marks at the value 4 on both the left and right side of the axis.
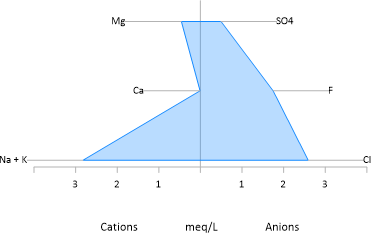
Tick labels are controlled by the Tick label range properties.
Label Value Divisor
Enter a value in the Label value divisor box to divide the label by the value entered. For example, this is useful when you want to display only the first two digits of a data point that is in the tens of thousands. A Label value divisor of 1000 would make a label of 25000 appear as 25.
Label Alignment
For standard X Axes, Z Axes, and angle axes, you can set the tick label alignment to the right of the tick marks, centered on the tick mark, or to the left of the tick mark by selecting Left, Center, or Right from the Label on side of tick list. For Y Axes, you can set the tick label alignment to the top of the tick marks, centered on the tick mark, or below the tick mark by selecting Above, Center, or Below from the Label on side of tick list. To change the Label on side of tick, click on the existing option and select the new option from the list.
3D Angled Tick Mark Labels
On 3D Axes, check the box next to the Angled option to draw tick mark labels at the same angle as the axis. If this box is not checked, the labels are always displayed parallel to the screen, no matter how the graph is rotated.
Label Settings
The Label Settings section includes properties for the appearance of the labels, including font, format, background, and position. The Label Settings section properties can be set independently for major and minor tick labels.
Labels to Edit
The Labels to edit property controls which labels are being edited by the Label Settings properties. Select Major labels to change the major tick label properties. Select Minor labels to change the minor tick label properties. The Labels to edit field is only displayed when both major and minor tick labels are displayed on the axis.
Frequency
For linear, log base 10, or natural log standard axes and angle axes, the Major label frequency or Minor label frequency property determines how many tick marks contain labels. For example, when Major label frequency set to 1, every major tick mark is labeled. When the Major label frequency is set to two, every other major tick mark is labeled. The Major label frequency or Minor label frequency value can be any whole number between 1 and 100. To display no labels, clear the Show major tick labels and/or Show minor tick labels box.
For probability axes, you can set the major tick label Frequency to Dense, Medium, or Sparse. The Dense setting labels very major tick, Medium labels every other major tick, and Sparse labels every third major tick.
Axes with a log base 10 scale have minor tick label Minor label frequency options of All; at the 2, 4, 6, 8 minor ticks; at the 2, 3, 5 minor ticks; at the 2, 5 minor ticks; and at the 3 minor tick. To change the minor tick label Minor label frequency for log axes, click the current option and select the desired option from the list.
Label Format
The Label Format section includes the font, format, background and label width properties for the tick labels.
Label Font
Click the ![]() next to Font to set the label
font properties. The font
Face, Size (points), Color, Opacity,
Bold, Italic, Underline, and Strikethrough properties can be set for most labels.
next to Font to set the label
font properties. The font
Face, Size (points), Color, Opacity,
Bold, Italic, Underline, and Strikethrough properties can be set for most labels.
Label Format
Click the ![]() next to Format to set the label format properties. The label
Type, display of numbers, Prefix, and
Suffix can be set for labels.
next to Format to set the label format properties. The label
Type, display of numbers, Prefix, and
Suffix can be set for labels.
Label Background
Click the ![]() next to Background to set the
label background properties. The Background
is the area behind the label. Click the next to Line
to set the line properties
for the line that goes around the text. Click the next to Fill
to set the fill properties
for the area around the text.
next to Background to set the
label background properties. The Background
is the area behind the label. Click the next to Line
to set the line properties
for the line that goes around the text. Click the next to Fill
to set the fill properties
for the area around the text.
Limit Label Width
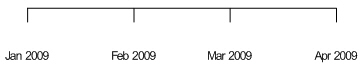
For major labels only, you can limit the width of the label that appears. When the label reaches the maximum width, the label wraps to a second line. Check the box next to Limit label width to limit how wide the tick labels can be by using the Break at spaces and Width options.
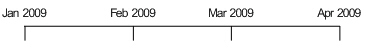
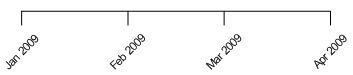
Break at Spaces
For major labels only, once the Limit label width option is checked, you may choose to check the Break at spaces box to break the labels only at spaces. For example, if the labels are Jan 2009, Feb 2009, Mar 2009, etc. Then, the Break at spaces will start a new line at the space between the month and the year. When multiple spaces occur, the break will occur at the space nearest the Width value. When the Break at spaces box is cleared, breaks can occur in the middle of a word or number.
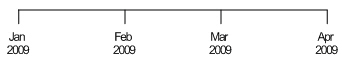
The Limit label width box and
the Break at spaces box are
checked in this example. A line break occurs at the
space between the month and year.
Width
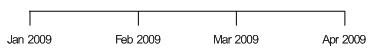
For major labels only, once the Limit label width option is checked, you may enter a value in the Width box to set a maximum label width in page units. Width values must be between 0.05 and 5 inches (0.127 and 12.7 centimeters). Once the Width value is set, any label text exceeding the maximum width will wrap to the next line.
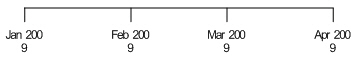
The Limit label width box
is checked in this example. The
Width is set to 0.50
in causing a text wrap at a specific
width.
Log Labels One Digit
For minor labels only, the Log labels one digit option is available when the axis Scale is set to log base 10. When the scale is set to log base 10, axis labels are displayed without zeros after the first digit when the Log labels one digit option is checked.
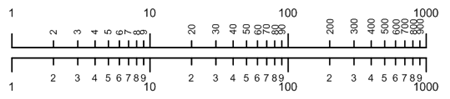
The same axis displayed with Log labels one digit cleared on top
and with Log labels one digit checked on bottom.
Label Position
The Label Position properties specify where the labels are in relation to the axis, the offset from the axis or tick marks, and the label angle.
Label Side
The Labels on side of axis option specifies on which side of the axis to display labels. With X Axes and Z Axes, you can show labels Above or Below the axis. With Y Axes, you can show labels to the Right or Left of the axis. With angle axes, you can show the labels Outside or Inside the axis.
The Labels on side of axis option is
Above for this X Axis label example.
The Labels on side of axis option is Below for this X Axis label example.
Offset - X and Y Axes
The X Offset and Y Offset controls the distance between the tick mark and the tick label. The X Offset property moves the label horizontally. The Y Offset moves the label vertically. An offset of zero places the labels so that the label is just touching the tick mark. The Offset value is in page units. Enter a value between -5 and 5 inches (-12.7 and 12.7 centimeters).
![]()
The Y Offset is set to 0.00
inch in this example.
The Y Offset is set to 0.40
inch in this example.
Offset - Z Axis
The Offset controls the distance between the tick mark and the tick label for a Z axis. An offset of zero places the labels so that the label is just touching the tick mark. The Offset value is in page units. Enter a value between -5 and 5 inches (-12.7 and 12.7 centimeters).
Label Orientation
Angle axes have a Label orientation option that controls the way labels are displayed. Setting the Label orientation to Horizontal makes all of the labels have the same horizontal rotation. Setting the Label orientation to Radial causes the labels to be drawn parallel to the ray extending from the plot origin through the label. The label is read from the angle axis outward. For example, the 45 degree label is rotated counter-clockwise 45 degrees. The 270 degree label is rotated 180 degrees and displays upside-down. To change the Label orientation, click on the current option and select the new option from the list.
Angle
The labels can be rotated by entering a number into the Angle box. Positive values rotate the labels counter-clockwise. Negative values rotate the labels clockwise. The Angle is listed in degrees and can be a value between -360 and 360 degrees.
The Angle is set to 45
degrees in this example.
Between Ticks
For major labels only, the Between ticks option shows tick labels between the major tick marks. To display the label between the tick marks, check the box next to Between ticks. This option is useful when the area between tick marks should be labeled. Ticks move to the right. The last tick label is moved between the last tick mark and the end of the axis.
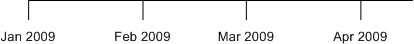
The Between ticks option is not
checked in this example.
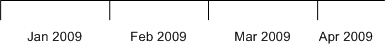
The Between ticks option is checked
in this example.
Label Line
Label lines can be used to connect the text label to the tick mark. If the labels have been moved with the Graph Tools | Plot Tools | Move Labels command, a line is displayed. The line goes from the label to the tick mark. Change the label leader line properties on the Line page in the Property Manager.