Box Plot Axes
Box plot axes appear on box plots and notched box-whisker plots. Box plot axes contain the header value for each variable in the worksheet. When Data in groups is selected, a second set of labels displaying the categories will also be included. Box plot axes are X axes for vertical box plots and Y axes for horizontal box plots.
Box plot axes are created automatically when the box plot or notched box plot is created. Box plot axes cannot be added to an existing graph. Also please note that for box plots, the axis labels are always treated as character data, even if they represent numeric values. The numeric values are converted to text specifically for labeling the box plot axes.

Example 1: A
box axis shows a set from each column. The set
names
are from the column headers.
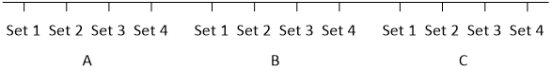
Example 2: A grouped box axis shows a set from each column with the
categories below. The set names are from the column headers
and the category names are from the category column.
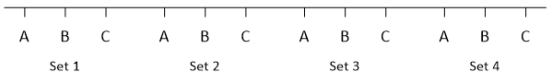
Example 3: A grouped box axis shows the categories with the set from
each column below. The set names are from the column headers
and the category names are from the category column.
Editing an Existing Box Plot Axis
To change the features of a box plot axis, click once on the axis in either the plot window or the Object Manager to select it. The properties of the selected axis are displayed in the Property Manager.
Multiple axes can be selected and edited at once. To select multiple axes, click on the first axis to select it. Hold down the CTRL key and click on the second axis In the Object Manager.
Axis Scale
By default, the Scale for box plots and grouped box plot axes is equidistant. This means that the ticks for each category and variable are distributed evenly across the axis.
A grouped box plot with numeric categories and a single variable has all the additional Scale options of a standard axis. These options enable combining and aligning box plots with other plot types.
Click the following tabs in the Property Manager to change different properties: