Change Colors
When using multiple plots, the Graph Tools | Plot Tools | Change Colors command can change both the line color and fill color at the same time in all the plots. There are exceptions for certain types of plots and these exceptions are detailed in the table below.
Changing Line and Fill Colors
Select a graph that has at least two plots open, one of which is a plot type found in the table below.
Click Graph Tools | Plot Tools | Change Colors.
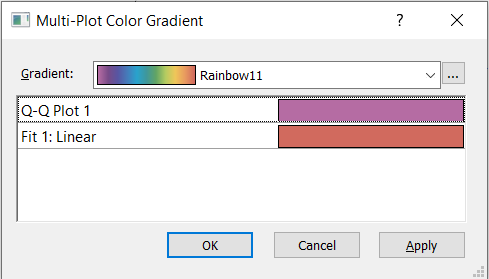
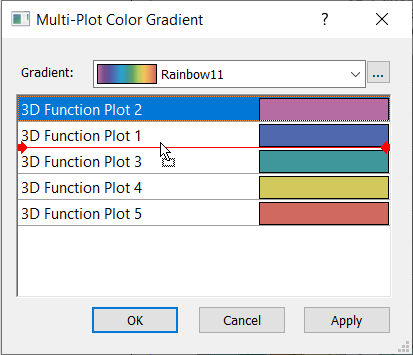
The Multi-Plot Color Gradient dialog appears with the plots listed. The plots are in the opposite order they are listed in the Object Manager.
|
In the Gradient box click the list to show the available color gradients. Select a gradient. When plots are added or deleted, colors from the gradient are automatically applied to the new list of plots.
Click-and-drag plots in the Multi-Plot Gradient Color Gradient dialog to rearrange the plots in the list. The order of colors does not change.
|
Plots may be removed from the list by clicking on the plot name and pressing DELETE.
Individual plot properties can be changed outside of this dialog box. Select the individual plot and make modifications in the Property Manager. More information about customizing individual plots can be found here.
Multi-Plot Color Gradient applies to the following plots with the described results or exceptions:
| Basic Plots | |
| 2D Bubble Plots | The line color of the bubble changes as does fill color of the centroid symbol. Line color of the centroid symbol and fill color of the bubble do not change, nor do any properties for a bubble symbol (if you're displaying one). |
| 2D Line/Scatter Plots | The line color changes as does the fill color for the symbols. Symbol line color and plot fill color do not change. |
| 2D Step Plots | The line color changes as does the fill color for the symbols. Symbol line color and plot fill color do not change. |
| 3D XYZ Line/Scatter Plots | The line color and symbol color change. There is no separate plot fill or symbol line color. |
| 2D Function Plots | The line color changes. For the fill and symbol properties, both the line and fill, do not change. |
| 3D Function and Ribbon/Wall Plots | The ribbon fill changes. The line and wall fill do not change. |
| 3D Step Plots | The ribbon and wall fill colors change but the line color does not change. |
| Bar Charts | |
| For all of these types of Bar Charts, the fill color will change but the line color does not. | |
| Polar Plots | |
| Polar Rose Chart | Only the bar fill properties change. The bar line properties, error line properties, and error fill properties do not change. |
| 2D Polar Bar Charts | The bar fill properties change. The bar line properties do not. |
| Polar Function Plots | The line properties change. The symbol properties do not. |
| Polar Line/Scatter Plots | The line properties and symbol fill properties change. The symbol line properties do not. |
| Polar Vector Plots | The symbol fill color change. The symbol line color and plot line color do not. |
| Ternary Plots | |
| Ternary Line/Scatter Plots | The line and symbol fill properties change. The symbol line properties do not. |
| Ternary Bubble Plots | The line color of the bubble changes as does fill color of the centroid symbol and the plot line color. The line color of the centroid symbol and fill color of the bubble do not change. If a bubble symbol is displayed, the properties for it do not change. |
| Specialty Plots | |
| Stiff Plots | The fill properties do change. Line and symbol properties do not change. |
| High-Low-Close Plots | The line and Up and Down fill properties change. |
| 2D Vector Plots | If the symbol fill color is turned on, the fill colors will change. The line and symbol line properties do not change. |
| XYZ Vector Plots | The symbol color changes (if turned on; no fill/line, just symbol color). Line properties (including drop lines and projection lines) do not change. |
|
Statistical Plots |
|
|
The line color changes as does fill color for the symbols. The symbol line properties do not. |
|
|
The fill color changes but the line color does not. |
|
|
The fill properties change. The line and symbol properties do not. |
|