XYZ Bar Charts
|
Click the Home | New Graph | Bar | XYZ Vertical Bar Chart or Home | New Graph | Bar | XYZ Horizontal Bar Chart command to display data as bars drawn from a base value to the Y data value and positioned according to a Z value. If more than one variable is used (multiple Y values for each X, Z value), the bars can be stacked on top of one another or they can be adjacent to each other. When adjacent bars are used the values are plotted side by side. When stacked bars are used the total height of the stacked bars is equal to the sum of the Y values. Click the XYZ Vertical Bar Chart or XYZ Horizontal Bar Chart button to create a 3D horizontal or vertical bar chart from 3 variables. |
|

|
|
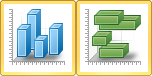
3D XYZ bar charts show X, Y, and Z variables. |
The bars can be displayed vertically or horizontally. The bar chart discussion assumes a horizontal bar chart; reverse the X and Y for a vertical bar chart.
Creating a New XYZ Bar Chart
To create an XYZ bar chart:
- Click the Home | New Graph | Bar | XYZ Vertical Bar Chart or Home | New Graph | Bar | XYZ Horizontal Bar Chart command.
- Select a data file in the Open Worksheet dialog. You can select a new data file or you can select an open data file in the Open worksheets section.
- Click the Open button. An XYZ bar chart is created using the default properties.
Editing 3D XYZ Bar Chart Properties
To change the features of an XYZ bar char, including the columns used to create the chart, first select the chart in the plot window or Object Manager and then edit its properties in the Property Manager.
Click the following tabs in the Property Manager to change different properties: