Function Plots
|
Click the Home | New Graph | Function | Y=F(X) Function Plot, Home | New Graph | Function | X=F(Y) Function Plot, or Home | New Graph | Function | Parametric Function Plot command to display mathematical functions on a graph. Data files are not required for this type of plot. You can plot Y as a function of X, plot X as a function of Y, or plot a parametric equation where X and Y are functions of a third variable, T. The X=F(Y) function plot is commonly used to create vertical lines in the plot, for example where X = F(Y) = 100. Regardless of the command clicked to create the plot, any 2D function plot can be changed to another 2D function type in the Property Manager. Click the Y=F(X) Function Plot, the X=F(Y) Function Plot, or the Parametric Function Plot buttons to create the function plots. You can add a title to an existing function plot through the Title tab in the Property Manager |
|


|
|
|
|
|
This 2D function plot displays the Y=F(X) function cos(2*X). |
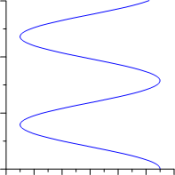
This 2D function plot displays the X=F(Y) function cos(Y). |
This 2D function plot displays the X=F(T), Y=G(T) parametric expression X=cos(t-2), Y=sin(t+3). |


Creating a New Function Graph
To create a function graph:
- Click the Home | New Graph | Function | Y=F(X) Function Plot command, the Home | New Graph | Function | X=F(Y) Function Plot, or the Home | New Graph | Function | Parametric Function Plot command.
- A function plot is created using a default equation.
When plotting a function with discontinuity, for example plotting Y=1/X from -10 ≤ X ≤ 10, we recommend the following settings:
- Set the Plot page Missing data property to Discontinuous plot.
- Set the axes limits to fixed custom values. Otherwise the axes may scale to extreme values automatically.
- Experiment with the Data Limits page Number of points property to ensure the function plot displays as desired. With the Y=1/X example from above where both X and Y axes range between -10 and 10, a Number of points value of 201 extends the function plot across the entire graph, while a Number of points value of 199 does not.
Editing Function Plot Properties
To change the features of a function plot — including the equations used to create the plot — first select the function plot in the plot window or Object Manager and then edit its properties in the Property Manager.
Click the following tabs in the Property Manager to change different properties: