Box Plots
|
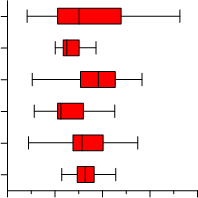
Click the Home | New Graph | Statistical | Vertical Box Plot or Home | New Graph | Statistical | Notched Vertical Box Plotcommand to show the minimum, maximum, median, lower quartile, and upper quartile as box and whisker plots for a particular X variable group. Click the Home | New Graph | Statistical | Horizontal Box Plot or Home | New Graph | Statistical | Notched Horizontal Box Plot command to show the minimum, maximum, median, lower quartile, and upper quartile for a particular Y variable group. |
|
|
Box plot and notched box plot orientation cannot be changed after the plot is created. You must delete the existing plot and create the desired plot to change the box plot orientation, e.g. from Vertical Box Plot to Horizontal Box Plot. The caps, or whiskers, at the end of each box indicate the extreme values (minimum and maximum, inter-quartile range times a factor, or a percentage of the data), the box is defined by the lower and upper quartiles, and the line in the center of the box is the median. The values are sorted before referencing. |
|
|
||
|
Box plots show extreme values, median, lower quartile, and upper quartile information for groups of data. |

In addition, the box plot options let you display symbols for each of the outlier samples in your data group. The definitions of these terms are:
Creating a New Box Plot
To create a 2D box-whisker plot:
- Click the Home | New Graph | Statistical command and then click Vertical Box Plot, Notched Vertical Box Plot, Horizontal Box Plot, Notched Horizontal Box Plot.
- Select a data file in the Open Worksheet dialog. You can select a new data file or you can select an open data file in the Open worksheets section.
- Click the Open button. A box-whisker plot is created using the default properties.
Editing Box Plot Properties
To change the features of a box-whisker plot, including the columns used to create the plot, first select the box plot in the plot window or Object Manager and then edit its properties in the Property Manager.
Click the following tabs in the Property Manager to change different properties: