Line, Scatter, and Line/Scatter Plots

|
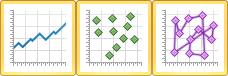
| Line/Scatter plots show data as lines, lines and symbols, or only symbols. This graph has three plots: a pink line only plot, a green symbol only plot, and a blue line and symbol plot. |
Creating a New Line, Scatter, or Line/Scatter Plot
To create a new line, scatter, or line/scatter graph:
- Click the Home | New Graph | Line/Scatter | Line Plot, Home | New Graph | Line/Scatter | Scatter Plot, or Home | New Graph | Line/Scatter | Line/Scatter Plot command.
- Select a data file in the Open Worksheet dialog. You can select a new data file or you can select an open data file in the Open worksheets section.
- Click the Open button. A line, scatter, or line/scatter plot is created using the default properties.
Editing an Existing Line, Scatter, or Line/Scatter Plot
To change the features of a line, scatter, or line/scatter plot, click once on the plot in either the plot window or the Object Manager to select it. The properties of the selected line/scatter plot are displayed in the Property Manager.
Click the following tabs in the Property Manager to change different properties:
Graph Properties
The graph properties contain the following pages in the Property Manager.