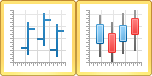
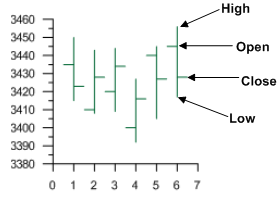
High-Low-Close Plots
|
| Hi-low-close plots show four variables, typically stock values. |
Creating a New High-Low-Close Plot
To create a high-low-close plot:
- Click the Home | New Graph | High-Low-Close Plot or Home | New Graph | High-Low-Close Candlestick Plot command
- Select a data file in the Open Worksheet dialog. You can select a new data file or you can select an open data file in the Open worksheets section.
- Click the Open button. A high-low-close plot or high-low-close candlestick plot is created using the default properties.
Editing High-Low-Close Plot Properties
To change the features of a high-low-close plot, including the columns used to create the graph, select the high-low-close plot in the plot window or Object Manager and then edit its properties in the Property Manager.
Click the following tabs in the Property Manager to change different properties: