Q-Q Plots and Normal Q-Q Plots
The Normal Q-Q Plot plots the distribution of a single data set against the normal distribution. To change a Q-Q plot to a Normal Q-Q plot, change either the X variable or Y variable property on the Property Manager Plot page to None.
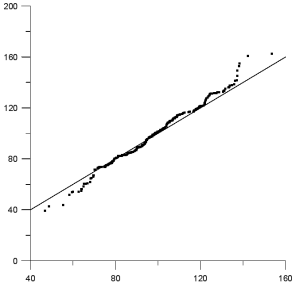
The y=x line is also plotted on both the Q-Q plot and the normal Q-Q plot.
|
|
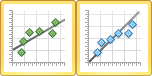
Q-Q plots show data as symbols with a y=x line This plot compares two data sets that are closely related, so the data fall almost always along the y=x line. |
Creating a Q-Q Plot or Normal Q-Q Plot
To create a new Q-Q plot or normal Q-Q plot:
- Click the Home | New Graph | Statistical | Q-Q Plot or the Home | New Graph | Statistical | Normal Q-Q Plot command.
- Select a data file in the Open Worksheet dialog. You can select a new data file or you can select an open data file in the Open worksheets section.
- Click the Open button. A Q-Q plot or normal Q-Q plot is created using the default properties.
Editing a Q-Q Plot or Normal Q-Q Plot
To change the features of a Q-Q plot or a normal Q-Q plot, click once on the plot in either the plot window or the Object Manager to select it. The properties of the selected Q-Q plot are displayed in the Property Manager.
Click the following tabs in the Property Manager to change different properties:
Graph Properties
The graph properties contain the following pages in the Property Manager.