Graph Wizard
Click the Home | Wizard | Wizard command to open the Graph Wizard. The Graph Wizard leads you through the necessary steps to create a new graph. This is the simplest and fastest way to make a graph with multiple plots. The Graph Wizard also makes it easy to add items such as axes, legends, and titles. For the most part, default plot parameters are used to create the plots. Alternatively, graphs can be created with the other commands on the Home tab. Note, Graph Wizard operations are not recorded by the Script Recorder. If you wish to record a script of the graph creation process, use the Home | New Graph commands.
The Graph Wizard consists of four dialogs:
- Graph Wizard - Select File where you select the data file you wish to plot.
- Graph Wizard - Select Plot Type where you select the plot type.
- Graph Wizard - Select Data Variables for Plot where you select the number of plots and the data columns/rows are defined for the graph.
- Graph Wizard - Select Graph Options where legends, axes, titles, gridlines, and colors are specified for the graph.
Graph Wizard - Select File
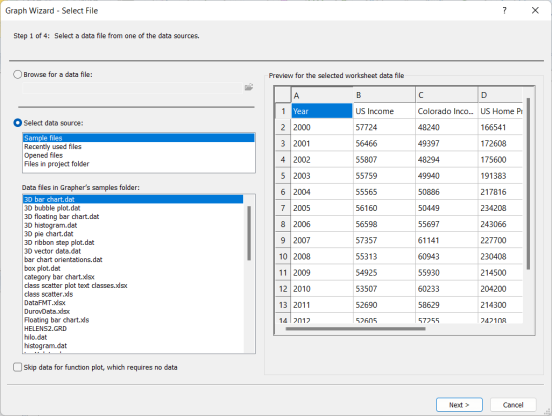
Click the Home | Wizard | Wizard command. The Graph Wizard is opened to the Graph Wizard - Select File page.
|
| Select a data file in the Graph Wizard - Select File dialog. |
If you know which file you wish to use,
- Select the Browse for a data file option.
- Click the
 button.
 - Select the data file in the Open dialog and specify any required import options.
Otherwise, select the Select data source option to browse files from the Sample files, Recently used files, Opened files, or Files in project folder lists. The Graph Wizard will open to whichever data source was selected the last time the Graph Wizard was used to create a graph.
A data file does not need to be selected when creating a function plot since no data are required for this type. If you wish to create a function plot, select the Skip data for function plot, which requires no data option. Generally, it is preferable to create a function plot via the Home | New Graph commands.
Once you have selected a data file, click Next to proceed.
Graph Wizard - Select Plot Type
The Graph Wizard - Select Plot Type page is displayed after selecting a data file. Only one plot type can be selected when using the Graph Wizard. If you wish to create a graph with multiple plot types, you can continue using the Graph Wizard and then convert plots to a different type after the graph is created, or you can close the Graph Wizard and use the Home | New Graph and Graph Tools | Add to Graph commands to manually create your graph.

|
| Select the plot type in the Graph Wizard - Select Plot Type dialog. |
Select the desired plot type in the Plot types list. Use the Category and Search options to filter the list of plots if necessary. A preview is displayed in the Plot Preview.
Click Next to proceed. Alternatively, click Finish to create the graph without specifying data variables and plot options. If you click Finish, the graph will be created as it appears in the Plot Preview.
Graph Wizard - Select Data Variables for Plot
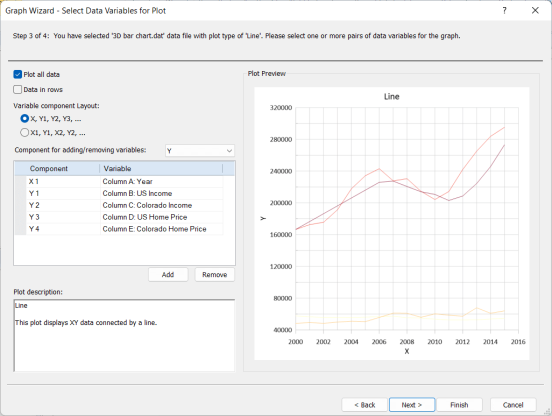
The Graph Wizard - Select Data Variables for Plot page is displayed after you have selected the plot type. Here you can specify which data in the data file is represented by a plot in the graph.
|
| Select the data variables for the plot(s) in the Graph Wizard - Select Data Variables for Plot page. |
Select the Plot all data option to automatically add as many plots as necessary to use every data column/row in the data file. Which components are added to the Component list when Plot all data is selected is controlled by the Data in rows, Variable component layout, and Component for adding/removing variables options.
Select Data in rows if the data are arranged where each row represents a new variable.
Specify the Variable component layout for the data.
- Select X, Y1, Y2, Y3 ... for data files with one X (independent) and many Y (dependent) variables.
- Select X1, Y1, X2, Y2, ... for more control over which X and Y pairs should be plotted together.
The Variable component layout options are not available for any plots that require three or more data columns/rows, and the Variable component layout options are also disabled for some two-component plots. A single data Variable can be shared between plots by setting multiple Variable fields to the same data file column/row when the X1, Y1, X2, Y2, ... option is used.
Specify which component type you'd like to add in the Component for adding/removing variables field. Then Add or Remove components and specify the Variable until you are satisfied with the Plot Preview.
Click Next to proceed. Alternatively, click Finish to create the graph without specifying plot options. If you click Finish, the graph will be created as it appears in the Plot Preview.
Graph Wizard - Select Graph Options
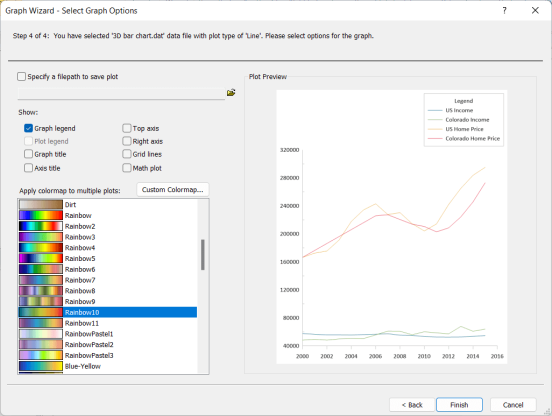
The Graph Wizard - Select Graph Options page is displayed after defining the data variables to plot. Select whether to save the graph upon creation and the graph features and colors.
|
| Select graph options in the Graph Wizard - Select Graph Options page. |
If you wish to save the graph and plot document once the graph is created,
- Select the Specify a filepath to save plot option.
- Click the button.
- Specify the path, file name, and file type in the Save As dialog.
Leave the Specify a filepath to save plot option cleared if you plan to save the document later.
Select or clear options in the Show list to add or remove titles, legends, axes, grid lines, or a math plot. The math plot is created as a summation plot by default. You can modify the math plot to use a different formula after creating the graph.
Select a colormap to apply to the plots to vary the colors in the graph in the Apply colormap to multiple plots list. Click Custom Colormap to define your own colormap for the plots.
Click Finish to create the graph as it is displayed in the Plot Preview.
The Graph Wizard will create the new graph in the current plot document when viewing a plot window. The Graph Wizard will create the new graph in a new plot document when using the Graph Wizard from the worksheet.