Title Properties
Titles can be added to almost any object in the plot window, including Graphs, Axes, Plots, and Color Scales. A title is a text label used to identify the object, provide units, or add descriptive information to the visualization. To view and edit graph title properties, click on the object in the Object Manager or plot window to select it, then, click on the Title tab in the Property Manager.
|
|
|
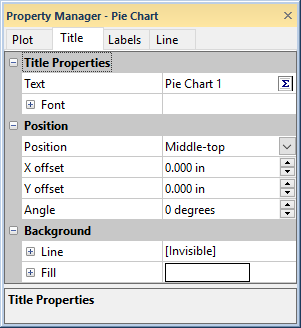
Set the title and title location for a graph on the Title page in the Property Manager |
Title Properties
The Title tab contains the following sections and properties to customize the appearance of your title.
-
Link to object name : Check this box to use the object name in the Object Manager for the title.
-
Use plot color for tile : Check this box to use the color set in the line color properties for the title text.
-
The Title Properties section includes the title text and font properties.
-
You can quickly add a title by typing directly in the Text field.
-
You can make quick font adjustments to the entire title Text by editing the font properties in the Font section. Alternatively, click the
 button to edit the title text and text properties
in the Text Editor dialog
button to edit the title text and text properties
in the Text Editor dialog
-
Position
Control the placement and orientation of the title relative to the selected object. You can choose from standard predefined positions or fine-tune the location using specific offsets and rotation settings.
-
Position: Select a predefined location for the title relative to the object. Options include Left-top, Middle-top, Right-top, Left-middle, Right-middle, Left-bottom, Middle-bottom, and Right-bottom.
-
Note: Selecting Left-middle or Right-middle automatically changes the title orientation to vertical (90 degrees).
-
-
Anchor: (Available for specific graph types) Select a predefined location for the starting anchor of title relative to the line. Options include Start of line, Middle of line, End of line.
-
Title along line: (Available for specific graph types) When checked, the title is rotated and aligned to run parallel to the axis line.
-
Horizontal alignment: (Available for graph types with an Anchor) Refine the title's position by defining how the title should be aligned in relation to the anchor. Options include Left, Center, Right.
-
Vertical alignment: (Available for graph types with an Anchor) Refine the title's position by defining how the title should be aligned in relation to the anchor. Options include Above, Center, Below.
-
X Offset: Refine the title's position by entering values in page units. Positive values move the title right; negative values move it left.
-
Y Offset: Refine the title's position by entering values in page units. Positive values move the title up; negative values move it down.
-
Angle: Enter a number in degrees to rotate the title. Positive values rotate the title counter-clockwise.
Background
Use the Line settings in the
Background section to
add a border around the title. Click the ![]() next to Line to open the line
properties section.
next to Line to open the line
properties section.
Use the Fill settings in the
Background section to add a background
fill to the title box. Click the ![]() next
to Fill to open the fill
properties section.
next
to Fill to open the fill
properties section.
Adding and Editing a Title
To add or edit a title for any object (Graph, Axis, Plot, or Color Scale):
- Select the object in the Object Manager or Plot window.
- In the Property Manager, click on the Title tab.
- Click the Editor button next to Title field.
- In the Text Editor, enter the title text and select the text properties.
- Click OK.
-
Alternatively, you can type plain text directly into the Text field in the Property Manager for quick edits without opening the editor.
-
See Color Scale - Contour Maps or Color Scale - Surface and Vector Plots for instructions on adding a color scale to a graph.
Removing a Graph Title
To remove a graph title:
- Select the object in the Object Manager or Plot window.
- In the Property Manager, click on the Title tab.
- Delete all text from the Text field in the Title tab or the Text Editor
Moving a Graph Title
To move a graph title:
- Select the object in the Object Manager or Plot window.
- In the Property Manager, click on the Title tab.
- Set the Position, X offset, and Y offset values.
- If the title should be moved an additional amount, click the Graph Tools | Plot Tools | Move Labels command.
- Click on the title, hold down the left mouse button and drag the title to the new location.
- Press ESC on the keyboard to exit move labels mode.