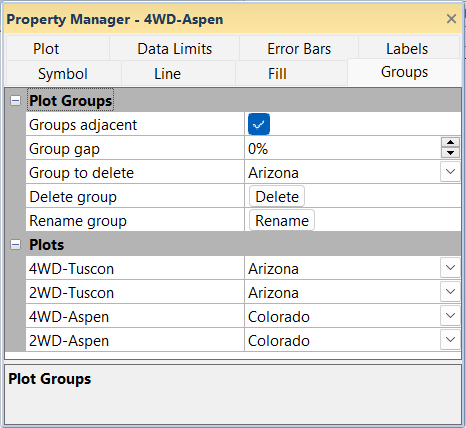
Plot Groups
The Groups page in the Property Manager is used to create bar chart and histogram plot groups. The bars or histograms within a group can be stacked or adjacent. The plot groups are drawn adjacent or overlapping. Ungrouped plots are always drawn overlapping grouped plots. Grouping various bar charts or histograms and changing the bar chart order in the Object Manager can provide interesting intra- and intergroup comparisons.
Drawing Order
Groups are drawn in order by group number. Group 1 is drawn first, Group 2 is drawn next, etc. Groups are plotted from left to right in vertical bar charts or histograms and from bottom to top in horizontal bar charts or histograms when the groups are plotted adjacent. The groups are drawn in order from back to front when groups are not plotted adjacent, i.e. the last group to be drawn will be visible when groups overlap.
Within groups, the draw order is determined by the plot order in the Object Manager. Plots that are lower in the Object Manager (earlier in the draw order) are plotted at the bottom of stacks, towards the left of adjacent vertical bars, or towards the bottom of adjacent horizontal bars. Conversely, plots that are higher in the Object Manager (later in the draw order) are plotted at the top of stacks, towards the right of adjacent vertical bars, or towards the top of adjacent horizontal bars.
Experiment with both the plot order in the Object Manager and the group number for the plots to determine the best presentation for your grouped bar charts and histograms.
|
|
|
The Groups tab in the Property Manager defines the bar groups. |
Groups Adjacent
The Groups adjacent property specifies whether groups are plotted adjacent to other groups or overlaid with other groups at the same location. Check the Groups adjacent box to plot to groups adjacent to one another. When the Groups adjacent box is not checked, the groups will overlap. Groups cannot be plotted adjacent to one another with the Polar Bar Chart.
|
|
|
|
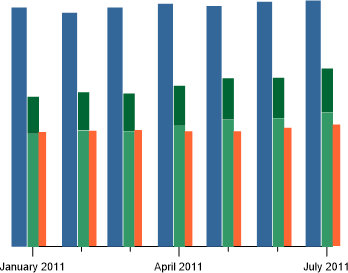
This example includes four bar charts in three groups. The two green bars are grouped and stacked. When Groups adjacent is not checked the bars are drawn overlapping. |
This example shows the same bar charts with Groups adjacent selected. The entire bar is visible in every month. |

Group Gap
The Group gap property specifies the space between groups when groups are adjacent, i.e. Groups adjacent is checked. Set the gap between bars from 0 to 5000 percent. The default setting is no gap between the groups. The gap size percentage is determined by the range of the X values.
Delete Group
The Group to delete option and the Delete group command are used to remove a group. First, select the group you wish to remove in the Group to delete field. Next click Delete to remove the bar chart group. Any plots in the deleted group will become ungrouped.
Rename Group
The Group to delete option and the Rename group command are used to rename a group. First, select the group you wish to rename in the Group to delete field. Next click Rename to rename the group in the Rename Group dialog.
Plots List
The Plots section of the Groups page includes all the plots in the graph and the group(s) to which the plots belong.
To move a plot into a different group, click the current group for a plot and select the desired group from the list. To make a plot ungrouped, select None from the list. Select New Group to add a group to the list.