Plot Page - Function Plots
To view and edit function plot properties, click on the function plot in the Object Manager or plot window to select it. Click the Plot tab in the Property Manager. You can change the axes and set equations and function intervals for the function plot or 3D function plot.
|
|
|
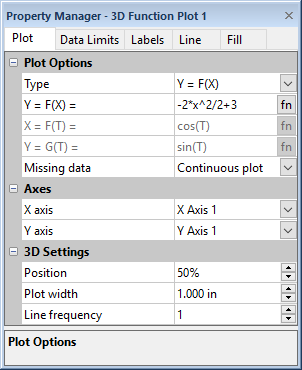
Click on the Plot tab in the Property Manager to edit the plot properties for the function plot. |
Plot Type
The Plot type property displays the type of plot.
Type
The Type option determines if the plot is created with a set of equations or a single equation. When the Type field is set to Y = F(X), functions are entered in the form Y as a function of X in the Y = F(X)= field. When the Type field is set to X = F(Y), functions are entered in the form X as a function of Y in the X = F(Y)= field. If Type is set to Parametric, enter X and Y as functions of T in the X = F(T)= and Y = G(T)= fields.
Function
Enter the function equation in the Y = F(X) = or X = F(Y) = box. The form of the function updates automatically with the Type selection.
For parametric equations, enter the X portion of the equation in the X=F(T) = box. Enter the Y portion of the equation in the Y=F(T) = box. To change the equation, highlight the existing equation. Type a new equation in the box. Press ENTER on the keyboard to make the change.
In both cases, you can click the ![]() button to open the Functions dialog
and add predefined mathematical
functions to the equation or you can type the functions into the fields
manually.
button to open the Functions dialog
and add predefined mathematical
functions to the equation or you can type the functions into the fields
manually.
Missing Data
When the function and value limits settings results in an undefined value, e.g. 1/0 or ln(-1), the value is not plotted. These undefined points are treated as missing data. You can display the missing data as part of a continuous or discontinuous line using the Missing data options. Setting Missing data to Continuous plot connects the data line before and after the missing data. Setting Missing data to Discontinuous plot breaks the line at the missing data sections of the data set. Data filtered using a Data Filter are included as missing data.
Change Axes
Click on the axis name next to the X axis, Y axis, or Z axis fields to change the axes used for the plot. Select another axis name from the list. Alternatively, click Select plots/axis to change the axis used by several plots on a graph at once.
See the Axis - Add to Graph page for information about how to add a new axis to the graph. Once the new axis is added to the graph, it will be available in the X axis, Y axis, or Z axis lists.
3D Settings
The 3D Settings section includes options for specifying the width, location, and number of lines in a 3D function plot.
Position
The Position option controls the location of the plot on the depth axis of the 3D plot. For example, 0 percent places the plot at the front of the graph, 100 percent places the plot at the back of the graph, and 50 percent places the plot in the middle of the graph.
Width
The Plot width controls the width of the plot. Plots can be 0.01 to 6 inches (0.025 and 15.24 cm) wide.
Line Frequency
Use the Line frequency field to control the cross lines along the plot width. The lines are usually drawn at each data point over the width of the plot, that is Line frequency is set to 1. When there are many points on the graph, the line color may overwrite most of the ribbon fill color. Use the Linefrequency option to skip lines on the plot. For example, if Line frequency is set to 5, every fifth line is plotted on the plot. To remove all of the lines, set the Line frequency to a number greater than the total number of data points. Up to 10,000 points may be skipped between lines.
Example 1
To create a plot using the equation:
Y= 3 - x2
- Select a function plot.
- Click the Plot tab in the Property Manager to access the Plot Properties page.
- Set Type to Y = F(X).
- Highlight the contents of the Y = F(X)= box and then type 3 - x^2.
- Move your cursor to the end of the equation and press ENTER on your keyboard. The equation is drawn on the graph.
|
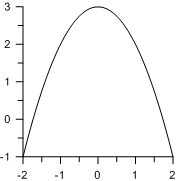
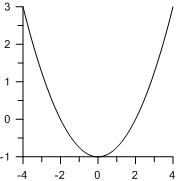
| This function plot is the result of the parametric equation listed in example 1. |
Example 2
To create a plot using the equation:
X = 2t
Y = t2 - 1
-2 £ 0 £ 2
- Select a function plot.
- Click the Plot tab in the Property Manager to access the Plot Properties page.
- Set Type to Parametric.
- Highlight the contents of the X = F(T)= field and enter 2*T.
- Highlight the contents of the Y
= G(T)= field and click the
 button to the right of the equation box.
 - In the Functions dialog, select POW(X,Y) from the function list.
- Click the Insert button in the Functions dialog.
- Replace X,Y in POW(X,Y) with T,2.
- After POW(T,2) type -1. Your equation in the Y=G(T)= field should appear like this:
POW( T,2 )-1
- Enter -2 in the First value field.
- Enter 2 in the Last value field.
|
| This function plot is the result of the parametric equation listed in example 2. |