Options - Display
You can set defaults such as file open/save paths, page units, undo
levels through the File | Options
command. In the Options dialog,
click the ![]() button next to Environment to
expand that section
to access these items. Changes made in the Options
dialog affect all subsequent documents. Existing documents and settings
are not changed.
button next to Environment to
expand that section
to access these items. Changes made in the Options
dialog affect all subsequent documents. Existing documents and settings
are not changed.
The Environment section has the following sub-sections: Display, Rulers and Grid, Selection, Plots, and Dialog Messages. Click Display on the left side of the dialog to display the Display options on the right side of the dialog. Use the Display options to control various display settings in Grapher.
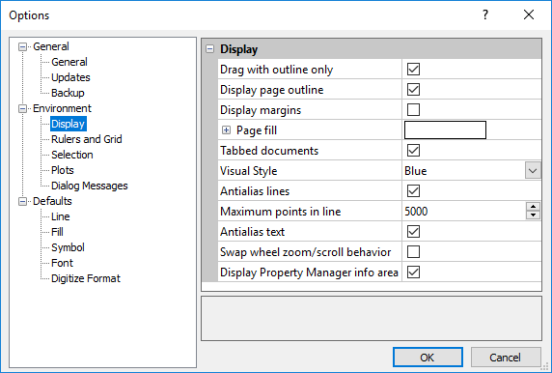
Use the Options dialog
to set Grapher preferences.
Drag With Outline Only
Check Drag with outline only to show a dashed outline of the selected object when it is moved while retaining the original location of the object. Uncheck this option to show the entire object move without retaining the original location of the object.
Display Page Outline
Use the Display page outline option to display or hide the page outline in the plot window. Check this option to display the page outline. Uncheck this option to hide the page outline. The page size is set through the File | Page Setup command.
Display Margins
Click Display margins to show the margin settings on the page as dashed lines. Uncheck this option to hide the page margins. Margins are set through the File | Page Setup command.
Page Fill
Use Page fill to set the background
fill. The fill is not intended to be printed or exported, but is only
for use in the Grapher window.
Click the ![]() button to the left of Page fill
to expand this section and select fill
properties for the Page fill.
button to the left of Page fill
to expand this section and select fill
properties for the Page fill.
Tabbed Documents
Check the box next to Tabbed documents to display each plot and worksheet window as a series of tabs. When viewing in tabbed document mode, the tabs may be dragged to reorder them. The left/right arrow buttons at the right of the tabs are used to scroll the tabs should there be more tabs than can fit along the top of the window.

Plot 1, Worksheet1, Plot2, and Worksheet2
are tabbed.
The left and right arrows are used to scroll.
When a document contains unsaved changes, an asterisk appears next to its tabbed name. The asterisk (*) disappears once the unsaved changes have been saved.
Visual Style
Change Visual Style option to change the visual look of Grapher. Select the Black, Blue, or Silver theme. The default is the Blue theme.
Antialias Lines
Check the Antialias lines option to use antialiasing to draw lines to produce smoother looking graphic objects.
Maximum Points in Line
Lines are antialiased when the Antialias lines option is checked and when the line does not contain more than the number of points specified in the Maximum points in line. Increasing this value slows the redraw of the graph, but will make lines on the screen appear smoother. Setting this value to -1 will result in all lines, regardless of how many points are in the line, being antialiased.
Antialias Text
Check the Antialias text option to use antialiasing to draw text to produce smoother looking text and symbol objects.
Swap Wheel Zoom/Scroll Behavior
The default behavior is for the wheel on a wheel mouse to control zoom in and zoom out. Check the Swap wheel zoom/scroll behavior for the wheel on a wheel mouse to control the page scroll.
Display Info Area
Check the Display Property Manager info area box to display a small box in the Property Manager that shows a short description of the selected option. The Property Manager information area is displayed by default.