Options - Dialog Messages
You can set defaults such as file open/save paths, page units, undo
levels through the File | Options
command. In the Options dialog,
click the ![]() button next to Environment to
expand the Environment section
to access these items. Changes made in the Options
dialog affect all subsequent documents. Existing documents and settings
are not changed.
button next to Environment to
expand the Environment section
to access these items. Changes made in the Options
dialog affect all subsequent documents. Existing documents and settings
are not changed.
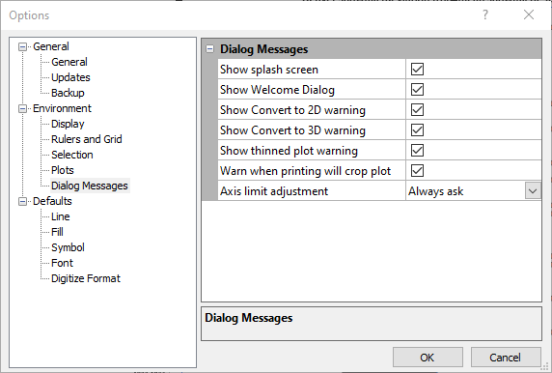
The Environment section has the following sub-sections: Display, Rulers and Grid, Selection, Plots, and Dialog Messages. Click Dialog Messages on the left side of the dialog to display the Dialog Messages options on the right side of the dialog. Use the Dialog Messages options to turn on the display of the splash screen, welcome dialog, and various warning messages.
|
|
|
Use the Options dialog to set Grapher preferences. |
Show Splash Screen
Check the Show splash screen option to display the splash screen when Grapher opens. When unchecked, the splash screen does not appear.
Show Welcome Dialog
Check the Show Welcome Dialog option to display the welcome dialog when Grapher opens. When unchecked, the welcome dialog does not appear.
Show Convert to 2D Warning
Check the Show Convert to 2D warning option to display the warning message when converting a 3D graph to a 2D graph. The warning indicates if any information will be lost after the conversion. When unchecked, the warning does not appear.
Show Convert to 3D Warning
Check the Show Convert to 3D warning option to display the warning message when converting a 2D graph to a 3D graph. The warning indicates if any information will be lost after the conversion. When unchecked, the warning does not appear.
Show Legend Change Warning
Check the Show Legend change warning option to display the warning message when changing all legend entries at once. The warning indicates if any information will be lost after the change. When unchecked, the warning does not appear.
Warn When Printing Will Crop Plot
Check the Warn when printing will crop plot option to display the warning message when the objects are outside the page margin.
Axis Limit Adjustment
The Axis limit adjustment field determines when to prompt a user whether to adjust the axis limit to the plot's edited clipping limit. Select Always ask to prompt the user any time a clipping limit change could result in new axis limits. Select Always adjust axis limit to suppress the prompt and always update the axis limits to match the clipping limits. Select Let graph calculate axis limit to suppress the prompt and always allow the plot to automatically calculate the axis limits based on the data.
