Fill Properties - Graph
Graphs can have a fill between two line/scatter plots, step plots, function plots, fit plots, or math plots on 2D graphs. The Fill page also includes the fill properties for 2D graph backgrounds and 3D graph back walls.
Click on the Graph object in the Object Manager or plot window to display the Between Fill tab in the Property Manager.
|
|
|
Set the plots to fill between and the between fill style on the Fill page in the Property Manager |
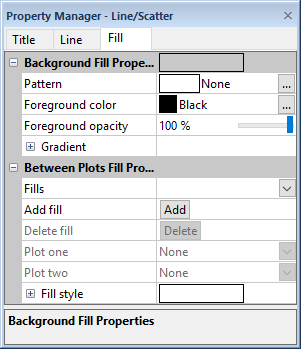
Background Fill Properties
The Background Fill Properties section includes the fill properties for a 2D graph background.
Back Wall Fill Properties
The Back Wall Fill Properties section includes the fill properties for a 3D graph back wall.
Between Plots Fill Properties
The Between Plots Fill Properties section includes the commands for adding a fill between two line/scatter, step, function, fit, or summation plots and setting the between fill properties.
Fills
The Fills list displays all of the available between plot fills in the currently selected graph. To change which fill is selected, click on the existing name and select the desired name from the list.
Add Fill
Click the Add button next to the Add fill option to add a new fill to the graph. After clicking Add, the Fills option changes to the new fill name. By default, fill names are named Fill 1, Fill 2, etc.
Delete Fill
Click the Delete button next to the Delete fill option to delete the currently selected fill. After clicking Delete, the Fills option automatically changes to the previous fill.
Plots
The Plot one and Plot two options control which plots are used for the selected fill. To select a plot, click on the existing plot name or None next to the Plot one or Plot two command. Select the desired plot name from the list. Any line/scatter plots, step plots, function plots, fit plots, or summation plots can be selected. Once one plot name is selected, set the other name in the other Plot one or Plot two list. The order that the plots are selected can make a difference when filling the plots.
Fill Style
The Fill style (Plot 1 > Plot 2) section includes the fill properties, including the pattern, color, and direction, for regions of the graph where Plot 1 is greater than Plot 2. The Fill style (Plot 2 > Plot 1) section includes the fill properties for regions where Plot 2 is greater than Plot 1. In graphs where the two plots intersect, the regions can have different fill properties to highlight the different values. However, the Direction must be the same in both sections and will automatically update if one is changed.
Creating a Fill Between Multiple Plots
To create a fill between multiple plots:
- Create a line/scatter plot, step plot, function plot, fit curve, or math plot.
- Add a second line/scatter plot, step plot, function plot, fit curve, or math plot to the graph.
- Select the graph in the Object Manager or plot window.
- Click on the Fill tab in the Property Manager.
- Click the Add button next to the Add fill option. A fill will be added to the Fills list.
- Click on the first plot you would like to fill between in the Plot one list.
- Click on the second plot you would like to fill between in the Plot two list.
- Click the
 next to Fill style to select
the between fill properties.
next to Fill style to select
the between fill properties.

In this example, the lower black line is the first Line/Scatter Plot, and the upper red
line is the second Line/Scatter Plot. The Blue region between the two plots was
created using Between Fill.
Modifying an Existing Fill Between Multiple Plots
To modify a fill between multiple plots:
- Select the graph object in the Object Manager or plot window.
- In the Property Manager, click on the Fill tab.
- Select the fill you would like to modify in the Fills list.
- If desired, change the plots to fill between listed in the Plot one and Plot two lists.
- Change fill properties in the Fill style section.
Deleting a Fill Between Multiple Plots
To delete a fill between multiple plots:
- Select the graph object in the Object Manager or plot window.
- In the Property Manager, click on the Fill tab.
- Select the fill you would like to delete in the Fills list.
- Click the Delete button next to the Delete fill option to delete the selected fill.
Fill Between Plots Tips
- The graph must contain a plot that supports between fills for the Between Plots Fill Properties section to be displayed on the Fill page.
- If you would like to fill between a plot and an axis, use the Fill Properties section in the plot's properties.