Export Data
Use the Graph Tools | Plot Tools | Export Data command to generate a data file from error bars, histogram, fit, function plot, polar function, rose diagram, or wind chart. Surface maps and contour maps generate grid files. If you wish to export data points from the plot, see the Export Data Points from the Plot.
To export the data:
- Create a fit, display error bars, or create one of the plots mentioned above. The plots can be 2D or 3D.
- Select the fit or plot.
- Click the Graph Tools | Plot Tools | Export Data command.
- If a fit curve was selected, set the desired settings in the Export Data dialog and click OK.
- A worksheet opens with the data.
If you are exporting a fit, function, or polar function, the X, Y locations are displayed. If you are exporting histogram or rose diagram data, the worksheet displays the range (bin size), count (number of points in each bin), upper bin limit, and cumulative frequency (current count plus the previous bin's counts). If you are exporting wind chart data, the file also includes the number of data in each wind speed bin.
To export error bar values, click on the line/scatter plot or bar chart to select it. Click the Graph Tools | Plot Tools | Export Data command. A worksheet is created with the X values, vertical error bar deviations, and vertical average value or Y values, horizontal error bar deviations, and horizontal average value for each error bar in the plot.
You can use the File | Save command to save the data in the worksheet.
Export Data Dialog
The Export Data dialog controls the starting and ending X values when exporting a fit curve. The increment and number of points can also be set.
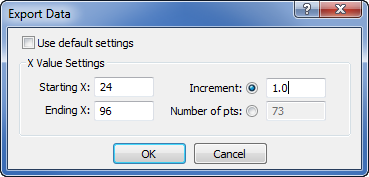
Set the Starting X, Ending X, Increment,
and Number of pts in the Export Data dialog.
Default Settings
Check the box next to the Use default settings option to use the Grapher defined values. Grapher uses the smallest number of points to recreate the plot, using the entire X limits. Uncheck the box to set the X values, increment, or number of points separately.
Starting X and Ending X
When the Use default settings option is unchecked, the Starting X and Ending X values can be entered. The Starting X value is the first value that should be created in the worksheet. Data with an X value before the Starting X value is not exported. The Ending X value is the last value that should be created in the worksheet. Data with an X value after the Ending X value is not exported. To change either the Starting X or Ending X, highlight the existing value and type the desired value.
Increment
The Increment sets the number of X units that are between exported rows. For example, if the Starting X is 24 and the Increment is 1, X values are exported starting at X=24 value and then every integer value after (X=25, 26, 27, etc.). The Increment and the Number of pts work in connection with each other. Changing one automatically changes the other.
Number of Points
The Number of pts sets the number of X values that are exported. The Increment is automatically calculated to the closest value so that the number of units between X values is constant for all data. For example, if the Starting X is 24 and the Ending X is 29 and the Number of pts is 5, the X values exported are X=24, 25.25, 26.5, 27.75, and 29. The Starting X and Ending X are always exported. The Increment and the Number of pts work in connection with each other. Changing one automatically changes the other.
OK and Cancel
Click OK to export the data with the selected options. Click Cancel to cancel the export. No worksheet is created when Cancel is clicked.