3D Histogram Plots
|
Click the Home | New Graph | Statistical | 3D Vertical Histogram or Home | New Graph | Statistical | 3D Horizontal Histogram command to display data in groups or bins. Each 3D bin represents a range of values on the X axis. The height of a bin represents the number of data points that fall within that bin’s range. If there is one Y value for each X value in the data set, use the bar chart rather than the histogram. Click the 3D Vertical Histogram or 3D Horizontal Histogram buttons to create 3D histograms. |
|

|
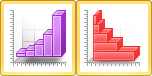
| This is an example of a 3D histogram. |
Creating a New 3D Histogram
To create a 3D histogram:
- Click the Home | New Graph | Statistical | 3D Vertical Histogram or Home | New Graph | Statistical | 3D Horizontal Histogram command.
- Select a data file in the Open Worksheet dialog. You can select a new data file or you can select an open data file in the Open worksheets section.
- Click the Open button. A 3D histogram is created using the default properties.
Editing 3D Histogram Properties
To change the features of a 3D histogram, including the bins used to create the histogram, first select the histogram in the plot window or Object Manager and then edit its properties in the Property Manager. Click the following tabs in the Property Manager to change different properties: