Error Bars
Error bars can be displayed on line plots, scatter plots, line/scatter plots, horizontal bar charts, vertical bar charts, 3D ribbon plots, 3D wall plots, 3D horizontal bar charts, and 3D vertical bar charts. You can display error bars for the average value (for 2D plots), sample standard deviation, population standard deviation, or standard error of the mean. Also, custom error bars can be calculated in the data file and displayed on the plot. Different positive and negative error bars can be displayed on the plot. It is best to display the original data as symbols rather than as a line when displaying error bars.

This scatter plot displays vertical error bars, showing the sample standard
deviation in the positive direction (blue) and standard error of the mean in
the negative direction (green). The red symbols are the average values.
NOTE: To export error bar values, click on the plot to select it. Click the Graph Tools | Plot Tools | Export Data command. A worksheet is created with the X values, vertical error bar deviations, and vertical average value or Y values, horizontal error bar deviations, and horizontal average value for each error bar in the plot.
Error Bars Properties
|
|
|
Edit the error bar properties on the Error Bars page. |
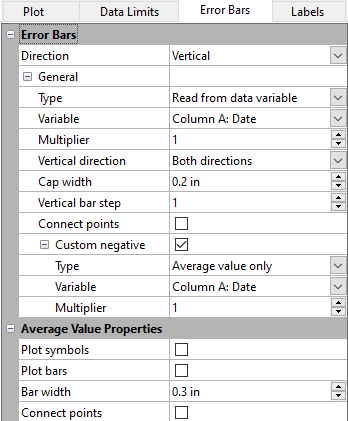
Direction
The Direction property specifies which error bars are displayed. Display vertical error bars when there are multiple Y values for each X value. Display horizontal error bars when there are multiple X values for each Y value. Display both vertical and horizontal error bars if you have calculated errors in both X and Y for the points in the scatter plot. You must use error values from a data column to display error bars in both directions. Even when no error bars are displayed, an average value can be displayed in the plot.
- Select None to not display error bars in the plot. A bar or symbol at the average value can still be included when no error bars are displayed.
- Select Vertical to display vertical error bars.
- Select Horizontal to display horizontal error bars.
- Select Vertical and Horizontal to display error bars in both directions. The Properties to edit field contains Vertical error bars and Horizontal error bars.
Properties to Edit
The Properties to edit list is only displayed when Direction is set to Vertical and Horizontal. Select which error bars you want to define. After defining one set of error bars, select the other set to define those. The properties available will be specific to the selected Direction.
General
Error Bar Type
The error bar Type can be set one of the following values:
- Select Read from data variable if custom error bars have been calculated in the worksheet to display the custom values. Select the worksheet data from the Variable list. This is the only option when displaying both vertical and horizontal error bars.
- Select Average value only to display the average Y value for each X value for vertical error bars or the average X value for each Y value for horizontal error bars.
- Select Sample standard deviation to show the sample standard deviation of the Y values for each X value for vertical error bars or the X values for each Y value for horizontal error bars. Sample standard deviation calculates the standard deviation of the subset sampled points.
- Select Population standard deviation to show the population standard deviation of the Y values for each X value for vertical error bars or the X values for each Y value for horizontal error bars. Population standard deviation calculates the standard deviation for the entire set of points.
- Select Standard error of the mean to display the standard error of the mean of Y values for each X value for vertical error bars or the X values for each Y value for horizontal error bars.
When negative error bars are displayed separately from positive error bars, this Type is for the positive direction only.
Variable
Select the worksheet data that contains the error values in the Variable field. When Read from data column error bars are used, error bars are displayed for every data row that has a value in the selected Column.
NOTE: this data should contain error values and not the data value plus or minus the error value. For example, in one sample, the freezing point of a mixture is determined to be 1.6 degrees Celsius and error is determined to be 0.2 degrees Celsius. The value in the error column should be 0.2 degrees, not 1.4 and/or 1.8 degrees Celsius. The error value (0.2) should be in the same worksheet row as the data value (1.6).
Multiplier
The Multiplier multiplies the length of the error bar by the number entered into the Multiplier box. For example, if a standard deviation error bar is multiplied by two, two standard deviations are displayed on the error bar. The Multiplier value can be any number from 0.01 to 10.0.
Error Bar Directions
Error bars can be displayed multiple ways. You can select the direction the error bars are displayed in the Vertical direction or Horizontal direction field.
- Both directions displays the error bars in the increasing and decreasing directions. For example, if the error bar is a sample standard deviation error bar, selecting Both directions shows the standard deviation on both sides of the mean. The Custom negative option is only available when the Direction is set to Both directions.
- Positive direction displays the error bar in the increasing axis direction only.
- Negative direction displays the error bar in the decreasing axis direction only.
- Away from zero plots error bar caps pointing away from zero. These error bars can be positive or negative.
- Towards reference plots error bar caps pointing toward zero. These error bars can be positive or negative.
Cap Width
You can change the width of the bar cap by changing the number in the Cap width box. The Cap width is the width, in page units, of the cap at the end of the error bar. The Cap width value can be any number between 0.0 and 5.0 inches (0.0 and 12.7 centimeters).
Bar Step
Use the Vertical bar step or Horizontal bar step option to skip error bars in the plot. For example, if the Vertical bar step is set to five, every fifth vertical error bar is plotted on the graph.
Connect Points
Select the Connect points option to connect the tops and bottoms of the error bars with a line. Clear the box to show error bars individually and not connected. This option is not available for 3D plot types. The connection line properties are located in the Line page Error Bar Connection Line section.
Custom Negative Error Bars
Check the box next to Custom negative to define error bars in the positive and negative direction separately. Type, Column, and Multiplier properties become available for the negative direction. The custom negative error bar options are most useful when the error is asymmetrical and therefore different in the positive and negative direction.
Average Value Properties
The Average Value Properties are displayed after the error bar properties in the Property Manager.
Plot Symbols
You can show average data values with a symbol or a bar. To display a symbol, select the Plot symbols option. The default symbol is displayed at the average value. To change the average value symbol properties, click the Symbol tab and edit the Average Value Symbol Properties.
Plot Bars
You can show average data values with a symbol or a bar. Select the Plot bars option to display a bar at the average data value. The average bar line has the same line properties as the entire error bar. The line properties are set in the Error Bar Line Properties section of the Line page.
Average bars can also be displayed by selecting Average value only for the Type in the Vertical error bars or Horizontal error bars properties.
Bar Width
The width of the average bar can be changed with the Bar width option. The average bar width can be any number between 0.0 and 5.0 inches (0.0 and 12.7 centimeters).
Connect Average Values
Select the Connect points option to connect the average values with a line. Clear the box to remove the average value connecting line. Edit the connecting line properties in the Error Bar Line Properties section of the Line page.