Polar Function Plots
|
Click the Home | New Graph | Function | Polar Function Plot or the Home | New Graph | Function | Polar Parametric Function Plot command to display mathematical functions on a polar axis. No data files are required for this type of plot. You can plot R as a function of A or plot a parametric equation where R and A are functions of a third variable, T. Click the Function Plot or Parametric Function Plot buttons to create polar function plots. |
|
|
|
|
|
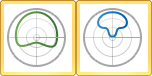
Polar function plots display functions on an angle axis. This polar function plot is displaying the parametric function R=F(T)=T and A=G(T)=2*T |
This polar function plot is displaying the function: R=F(A)=Cos(A)+2 |


Creating a New Polar Function Graph
To create a polar function graph:
- Click the Home | New Graph | Function | Polar Function Plot or the Home | New Graph | Function | Polar Parametric Function Plot command.
- A polar function plot is created with the default equation. Use the Property Manager to customize plot properties.
Editing Polar Function Plot Properties
To change the features of a polar function plot, including the equations used to create the plot, first select the plot in the plot window or Object Manager and then edit its properties in the Property Manager.
Click the following tabs in the Property Manager to change different properties: