Histogram Plots
|
Click the Home | New Graph | Statistical | Vertical Histogram or Home | New Graph | Statistical | Horizontal Histogram command to display data in groups or bins. Each bin represents a range of values on the X axis. The height of a bin represents the number of data points that fall within that bin’s range. If there is one Y value for each X value in the data set, use the bar chart rather than the histogram. Histograms can be oriented vertically or horizontally. The histogram discussion assumes a vertical orientation. Click the Vertical Histogram or Horizontal Histogram buttons to create histogram plots. |
|
|
|
|
|
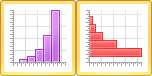
Vertical histograms display data in a series of groups called bins. |
Horizontal histograms display data in a series of groups called bins. |


Creating a New Histogram
To create a histogram:
- Click the Home | New Graph | Statistical | Vertical Histogram or Home | New Graph | Statistical | Horizontal Histogram command.
- Select a data file in the Open Worksheet dialog. You can select a new data file or you can select an open data file in the Open worksheets section.
- Click the Open button. A histogram is created using the default properties.
Editing Histogram Properties
To change the features of a histogram, including the bins used to create the histogram, first select the histogram in the plot window or Object Manager and then edit its properties in the Property Manager.