3D Function Plots
|
Click the Home | New Graph | Function | 3D Y=F(X) Function Plot, Home | New Graph | Function | 3D X=F(Y) Function Plot, or Home | New Graph | Function | 3D Parametric Function Plot commands to display mathematical functions as a 3D plot. Data files are not required for this type of plot. You can plot Y as a function of X, plot X as a function of Y, or plot a parametric equation where X and Y are functions of a third variable, T. The 3D XY Function Plot is commonly used to plot vertical lines, for example with X = F(Y) = 100. Regardless of the command clicked to create the plot, any 3D function plot can be changed to another 3D function type in the Property Manager. Click the 3D Y=F(X) Function Plot, 3D X=F(Y) Function Plot, or 3D Parametric Function Plot buttons to create 3D function plots. |
|

|
|
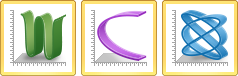
This is an example of 3D YX |
Creating a New 3D Function Graph
To create a 3D function graph:
- Click the Home | New Graph | Function | 3D Y=F(X) Function Plot command, the Home | New Graph | Function | 3D X=F(Y) Function Plot command, or the Home | New Graph | Function | 3D Parametric Function Plot command.
- A 3D function plot is created using a default equation.
Editing 3D Function Plot Properties
To change the features of a 3D function plot, including the equations used to create the plot, first select the plot in the plot window or Object Manager and then edit its properties in the Property Manager. Click the following tabs in the Property Manager to change different properties: