Ternary Line, Scatter, and Line/Scatter Plots
To plot data on a ternary diagram, the sum of the three data points (X + Y + Z) in any row must equal 100 percent. If the sum does not equal 100 percent you must normalize your data so that it meets this requirement, otherwise Grapher normalizes the data when it is plotted. Once this relationship has been established between the data points, you need only know the values of any two data points in order to determine the third. Reading a point on a ternary diagrams can be done by looking at the location of each point as it relates to the three axes.
You can add a line connecting the points in a ternary diagram. The line connects the data in the order it appears in the data file. To add a line, open the Line tab in the Property Manager, and then select a line style other than Invisible.

|
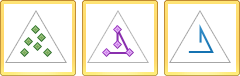
| Ternary diagrams show percentages in a three-component system. |
Creating a New Ternary Diagram
To create a ternary diagram:
- Click the Home | New Graph | Ternary | Ternary Scatter Plot, Home | New Graph | Ternary | Ternary Line/Scatter Plot, or Home | New Graph | Ternary | Ternary Line Plot command.
- Select a data file in the Open Worksheet dialog. You can select a new data file or you can select an open data file in the Open worksheets section.
- Click the Open button. A ternary diagram is created using the default properties.
Editing Ternary Diagram Properties
To change the features of a ternary diagram, including the columns used to create the diagram, open the ternary diagram properties by selecting the ternary diagram and editing the properties in the Property Manager. The properties available depend on the type of graph.
Click the following tabs in the Property Manager to change different properties: