Reading Ternary Diagrams
In Grapher, ternary axes are arranged with the X axis at the bottom of the plot, Y axis to the right of the plot, and Z axis to the left of the plot.
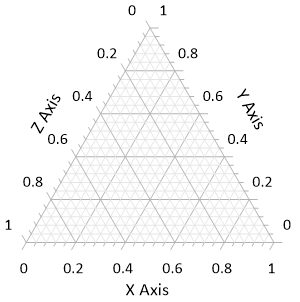
A consistent and dependable method for reading a ternary diagram includes four steps:
- Locate the 1 (or 100%) point on the axis. The axis values increase from the base opposite this point to the 100% point.
- Draw a line parallel to the base that is opposite the 100% point through the point you wish to read.
- Follow the parallel line to the axis. This is the component value for that axis.
- Repeat these steps for the remaining axes.
This process works regardless of the direction of the axes. For example, a piper plot includes a cation ternary plot and an anion ternary plot. The values increase in different directions in these two plots, but the principle to read them remains the same. The following example determines the X,Y,Z value for points on two different ternary plots:
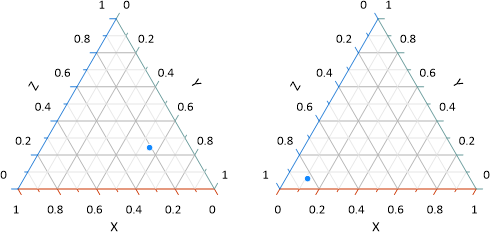
- Determine the 100% point. This is the lower-left point on the left plot and lower-right point on the right plot.
- Draw a line parallel to the base opposite the 100% point through the point to read.
- Follow the parallel line to the X axis. The X value is 0.21 on the left plot and 0.11 on the right plot.
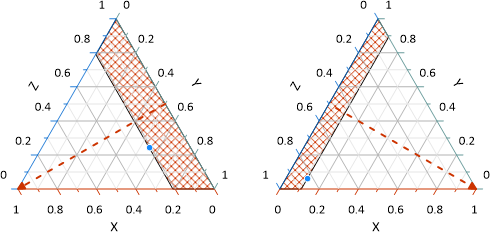
- Repeat steps 1-3 for the Y axes. The Y value is 0.55 on the left plot and 0.06 on the right plot.
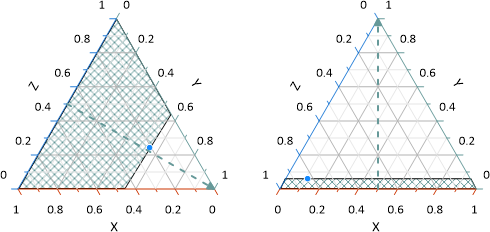
-
Repeat steps 1-3 for the Z axes. The Z value is 0.24 on the left and 0.83 on the right.
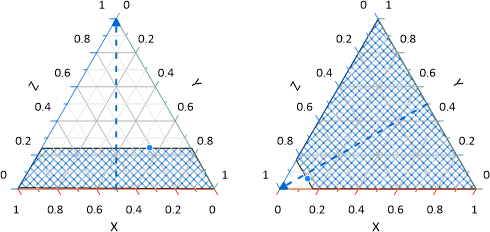
The coordinates for the point in the left ternary plot are 0.21, 0.55, 0.24. The coordinates for the point in the right ternary plot are 0.11, 0.06, 0.83. The coordinates add up to 1.00 in both cases, which is a good indication the values have been read correctly.