Line Properties
Line properties can be changed for a selected object. Many of the line properties, such as Style, Color, Opacity, and Width are common to all or most objects, and other objects have a few, different shared properties. The properties available will be specific to the type of plot. To find line properties, click on an object in the Object Manager or plot window, and then click the Line page in the Property Manager. You can set default line properties through the File | Options command.
Click one of the Line page section names in the list below to read more information about the properties in those sections or follow this help topic sequentially to read about each property.
- Common Properties (Style, Color, Opacity, and Width)
- Graph Line Properties
- Plot Line Properties
- Label Leader Line Properties
- Axis Line Properties
- Ticks Line Properties
- 2D and 3D Grid Line Properties
- Surface Mesh Lines
- Error Bar Line Properties
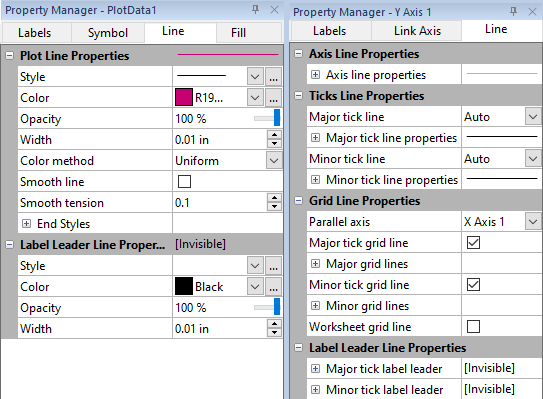
The following image shows two Line page examples:
- A Line page for a line/scatter plot with Plot Line Properties and Label Leader Line Properties
- A Line page for an axis with Axis Line Properties, Ticks Line Properties, Grid Line Properties, and Label Leader Line Properties
|
|
|
Example line properties in the Property Manager on the Line page. |
Common Properties (Style, Color, Opacity, and Width)
Style
The Style is the manner in which a line is drawn. To change the Style, click on the existing line next to Style. The Line Palette opens. Click on a style to use it for the selected line. To create a custom line style, click the  button at the right of the line style to open the Custom Line dialog, where you can create new line styles. 3D lines do not support the complex line styles. The standard line styles and custom line styles can still be used with 3D lines.
Color
The Color is the color of the
line. Click the existing color sample next to Color to open the
color palette. Click on a color in the
palette to use it for the selected line. To create a custom color,
click the button
at the right of the color sample to open the Colors
dialog.
Opacity
The Opacity controls the transparency of the line. Opacity values are between 0% (zero opacity, full transparency) to 100% (full opacity, zero transparency).
Width
The Width controls how a line appears. The line Width is a value from 0.0 to 0.5 inches (0.0 to 1.27 cm). A width of zero is one pixel wide. Values are in page coordinates.
Graph Line Properties
The graph line properties control the properties for the background line around the graph. In addition to the Common Properties (Style, Color, Opacity, and Width) described above, the graph properties include the Draw behind graph property.
Select the Draw behind graph option to draw the background line below any axes, ticks, or any other graph components that cross the graph background line. Clear the Draw behind graph option to draw the background line above any axes, ticks, or any other graph components that cross the graph background line.
Plot Line Properties
In addition to the Common Properties (Style, Color, Opacity, and Width) described above, these properties include:
Sample
The sample of the line is displayed next to Line Properties. The sample shows the line style, color, opacity, and width options.
Style
The Style is the manner in
which a line is drawn. To change the style, click
on the existing line next to Style. The line
style palette opens. Click on a style to use it for the selected line.
To create a custom line style, click the button at the right of the line style to open
the Custom Line dialog, where you
can create new line styles.
3D lines do not support the complex line styles. The standard line styles and custom line styles can still be used with 3D lines.
Line Color Method
- Uniform, where one color is used for the entire line
- Color variable, where line segment colors are specified by a color variable
- Colormap, where the color is varied along the line by a color gradient
Color Variable
When Color variable is selected, the Color variable is a column/row in the worksheet that contains a color specification. The color of the line segment changes based on the color in the worksheet column. The line color stays the selected new color until another color change is specified. To change the Line color variable, click the existing column or the word None. Select any other column in the worksheet.
Colors can be specified in the worksheet by many different methods. The table below provides some examples, where <r>, <g>, <b>, and <a> are red, green, blue, and alpha values between 0 - 255, and <color> is a predefined color name as it appears in the color palette. An alpha value of 0 is fully transparent and 255 is fully opaque.
| Method | Example |
| <color> | Red |
| <color>:<a> | Red:255 |
| RGB(<r>,<g>,<b>) | RGB(255,0,0) |
| RGB(<r>,<g>,<b>,<a>) | RGB(255,0,0,128) |
| \COLOR(<r>,<g>,<b>,<a>) | \COLOR(255,0,0,255) |
| R<r> G<g> B<b> | R255 G0 B0 |
| R<r> G<g> B<b> A<a> | R255 G0 B0 A255 |
| \RGBR<r> \RGBG<g> \RGBB<b> | \RGBR255 \RGBG0 \RGBB0 |
| \RGBR<r> \RGBG<g> \RGBB<b> \RGBA<a> | \RGBR255 \RGBG0 \RGBB0 \RGBA180 |
Colormap
When Colormap is selected, the colormap is a color gradient that is distributed along the line from the first vertex to the last vertex. Select the desired color gradient in the Colormap property field.
|
|
|
|
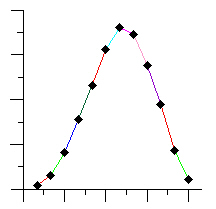
This Line/Scatter Plot uses a Line color column in the worksheet to change the color of the line segments. |
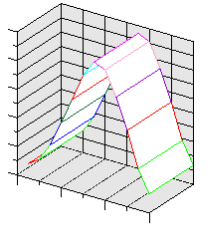
This 3D Ribbon/Wall plot uses a Line color column in the worksheet to change the color of the line segments. |
End Styles
The ends of the lines can have arrowheads on them. Some lines, for example 3D axis grid lines, do not support end styles.
The Start style is placed at the first vertex of the line. The End style is placed at the last vertex of a line. Not all lines can have arrowheads. For example, the line surrounding a rectangle does not support arrowheads.
The Scale property determines the size of the arrowhead. A larger Scale creates a larger arrow. A value of 1 makes the arrow the default size.
Draw Arrows
The arrow on a 3D vector plot is displayed by default. The arrow can be turned off by unchecking the box next to the Draw arrows option. This option is only available for 3D vector plots. When checked, the arrow is displayed. When unchecked, the arrow is removed.
Smooth Line
Select the Smooth line option to spline smooth the connecting line in the line plot. Control the amount of smoothing by entering a value between 0 and 1 in the Smooth tension field. The smaller the Smooth tension value, the more curved the connecting line. You may need to increase the tension if your line plot has areas where the line crosses itself. Clear the Smooth line option to connect data points with a straight line. The smoothing may not be visible if a Line color column is selected.
Use Color for Symbols
When the Line color column is specified, the Use color for symbols option is available. Symbols use the same color as the Line color column when the box next to Use color for symbols option is checked. The color of the symbol is changed on the row where the symbol occurs. The symbol is the same color as the line that follows the symbol.
If the Symbol table option is selected on the Symbol tab, the colors are read from the symbol table and not from the Line color column.
This is the same Line/Scatter plot
as above, with the Use color for
symbols option checked.
Color Scaling
On a vector plot, polar vector plot, or 3D vector plot, check the box next to Color scaling to set the color of the vector based on the vector length. Set the colors to use for the vectors with the Colormap option. When the Color scaling option is unchecked, the Color option sets the color of all vectors.
Show Color Scale
On a vector plot, polar vector plot, or 3D vector plot, check the box next to the Show color scale command to show the vector map's color scale. Note: this option is disabled if the Color scaling box is not checked.
Colormap
The Colormap option sets the
vector colors to be set from a color gradient. Click the existing color
gradient and select the desired color gradient from the list. Click the
button next to the color gradient to open the Color Gradient dialog. The Colormap option is disabled if
the Color scaling option is not
checked.
Label Leader Line Properties
See the Common Properties (Style, Color, Opacity, and Width) information described above for information on setting the Style, Color, Opacity, and Width properties.
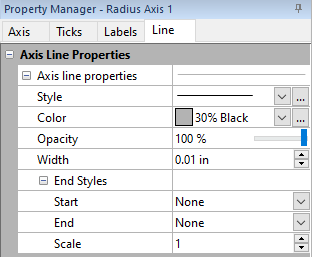
Axis Line Properties
See the Common Properties (Style, Color, Opacity, and Width) information described above for information on setting the Style, Color, Opacity, and Width properties.
End Styles
The ends of the lines can have arrowheads on them. Some lines, for example 3D axis grid lines, do not support end styles.
The Start style is placed at the first vertex of the line. The End style is placed at the last vertex of a line. Not all lines can have arrowheads. For example, the line surrounding a rectangle does not support arrowheads.
The Scale property determines the size of the arrowhead. A larger Scale creates a larger arrow. A value of 1 makes the arrow the default size.
|
|
|
Axis Line Properties |
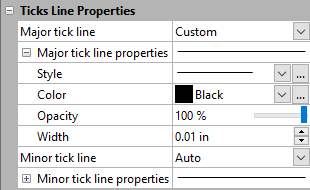
Ticks Line Properties
By default, axis tick marks have the same line properties as the axis line properties. Therefore, changing the axis line properties in the Axis Line Properties section also changes the tick mark line properties. You can override this setting and define unique line properties for the tick marks by setting the Major tick line and Minor tick line options to Custom and then setting the line properties in the following Major tick line properties or Minor tick line properties sections. See the Common Properties (Style, Color, Opacity, and Width) information described above for information on setting the Style, Color, Opacity, and Width properties.
|
|
|
Axis Ticks Line Properties |
2D and 3D Grid Line Properties
Grid line properties define both major and minor tick grid lines for the selected axis. If the selected plot is a 3D plot, grid lines can be defined for the 3D plane. To expand the properties sections for grid lines, check the box next to Major tick grid line and Minor tick grid line. The properties available will be specific to the type of plot.
The following property examples are from a polar wind chart and an XYX scatter plot. See the Common Properties (Style, Color, Opacity, and Width) information described above for information on setting the Style, Color, Opacity, and Width properties. All other axis grid line properties are described below.
|
|
|
2D and 3D Axis Grid Line Properties (polar wind chart and XYZ scatter plot examples) |

Parallel Axis
The Parallel axis defines the grid line direction and length. Grid lines are drawn parallel to the axis selected in the Parallel axis field, and grid lines are drawn to the same length as the axis selected in the Parallel axis field. Select the axis in the drop-down to apply the grid line properties to that axis or select All parallel axes to apply the grid line properties to all parallel axes.
If a Y Axis is selected in the Object Manager, all the Y axes in the graph appear in the Parallel axis list. If an X Axis is selected in the Object Manager, all of the X axes in the graph appear in the Parallel axis list.
At Major or Minor Labels Only
Grid lines can be displayed only at labeled tick marks. Check the boxes next to At major labels only or At minor labels only to display grid lines only when a label is displayed for a tick mark.
Step Value
Use the Step value to skip grid lines. For example, if the step factor is set to three, every third grid line is displayed.
End Styles
The ends of the lines can have arrowheads on them. Some lines, for example 3D axis grid lines, do not support end styles.
The Start style is placed at the first vertex of the line. The End style is placed at the last vertex of a line. Not all lines can have arrowheads. For example, the line surrounding a rectangle does not support arrowheads.
The Scale property determines the size of the arrowhead. A larger Scale creates a larger arrow. A value of 1 makes the arrow the default size.
Worksheet Grid Line
Select the Worksheet grid lines option to display grid lines at values in a worksheet. The worksheet must contain a data column that contains the values where the grid lines should appear.
Grid Line Examples
The following is an example of 3D grid lines and the property settings for the Z major grid line (exaggerated for illustration purposes). 3D grid lines are shown on the 3D plane, perpendicular to the selected axis.
- Z axis - yellow
- Y axis - green
- X axis - blue
|
|
|
XYZ Line/Scatter Plot 3D Grid Lines Example |

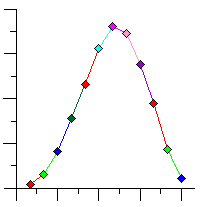
The following is an example of 2D grid lines (in XYZ line/scatter plot) and the property settings for the Z major grid line (exaggerated for illustration purposes). 2D grid lines are shown in the plane of the selected axis.
- X axis - blue
- Y axis - turquoise
- Z axis - purple
|
|
|
XYZ Line/Scatter Plot Grid Lines Example |

Surface Mesh Lines
Surface data maps, surface grid maps, and surface function maps can include a wireframe mesh on the surface represented by lines of constant X and lines of constant Z. The line properties are controlled independently in the X mesh lines and Z mesh lines sections. See the Common Properties (Style, Color, Opacity, and Width) information described above for information on setting the Style, Color, Opacity, and Width line properties.
|
|
|
Surface map line properties example |
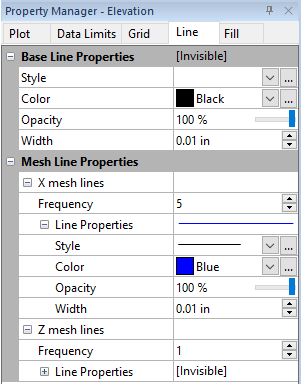
Mesh Line Frequency
The Frequency defines how many mesh lines are shown on the surface map. This value must be equal to or greater than 1. The Frequency displays a line at every nth grid row or column. For example, a Frequency of 1 displays a line at every grid row or column and a Frequency of 3 displays every third line.
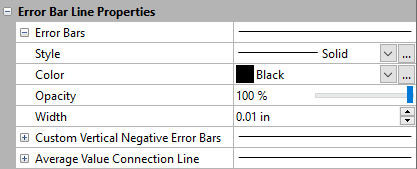
Error Bar Line Properties
The three types of lines for error bars (Error Bars, Custom Vertical Negative Error Bars, and Average Value Connection Line) can be defined using the common properties: Style, Color, Opacity, and Width).
|
|
|
Error Bar Line Properties example |