Labels Page - Ternary and Piper Diagrams
Data point labels can be shown on most plot types in Grapher. For ternary and piper diagrams, the labels can show data values or information from some other column in the data file. Labels can also be customized to appear in specific locations and can use a variety of formats, fonts, and colors to optimize the look and feel of the graph.
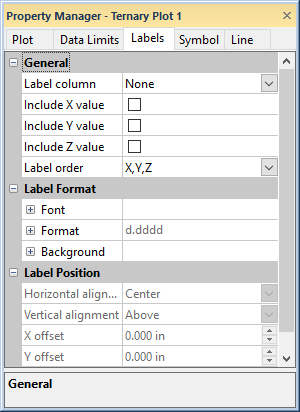
The following information is for the options contained on the ternary diagram Labels tabs. To edit the labels, click on a ternary plot to select it. In the Property Manager, click on the Labels tab.
|
|
|
Set label properties in the Property Manager on the Labels tab. |
Label Column
If the labels to be displayed on the plot are in another column, select the column in the Label column list. Click on the current column name next to Label column and select the new column to change the Label column. The plot automatically updates to include the labels from the new column. When worksheet labels are used, you cannot include X, Y, and Z values. If you wish to include X, Y, and/or Z values, set the Label column to None.
When labels are from a column in the data file, you can include symbols in labels using Math Text commands in the worksheet.
Worksheet Rows
You can choose the range of rows to plot labels in the Worksheet
rows group. Click the ![]() next to Worksheet rows to see the options.
The default rows are the first and last rows containing data.
next to Worksheet rows to see the options.
The default rows are the first and last rows containing data.
If Auto is selected for the First row and Last row, the first through last rows containing data are used as labels. To limit the range of the plotted labels, you can change the range of rows. Click on the word Auto and select Custom. Then highlight the existing value and type a new row number value. To return to the default values, click the word Custom and select Auto and First row or Last row will revert to the default rows.
Include X, Y, and Z Values
In ternary diagrams, you have the choice of displaying the X, Y, and Z values as part of the label by checking the boxes next to the Include X value, Include Y value, and Include Z value options. Check the box to display the label. The Include X value, Include Y value, and Include Z value options are not available when a column is specified in the Label column field. Set the Label column to None to use X, Y, and/or Z labels.
Label Order
In ternary diagrams, the label order list lets you specify the variable order in the labels. If a data point does not have a value for the variable it is not included in the label, the remaining values fill in the space; there is no gap where the missing variable would be located. To set the label order, click on the existing option. In the list, select the desired order. The plot will automatically update to show the new order. When X, Y, and Z values are included as labels, you cannot use worksheet labels.
Label Format
The Label Format section includes the Font, Format, and Background properties for the plot labels.
Label Font
Click the ![]() next to Font to set the label
font properties. The font
Face, Size (points), Color, Opacity,
Bold, Italic, Underline, and Strikethrough properties can be set for most labels.
next to Font to set the label
font properties. The font
Face, Size (points), Color, Opacity,
Bold, Italic, Underline, and Strikethrough properties can be set for most labels.
Label Format
Click the ![]() next to Format to set the label format properties. The label
Type, display of numbers, Prefix, and
Suffix can be set for labels.
next to Format to set the label format properties. The label
Type, display of numbers, Prefix, and
Suffix can be set for labels.
Label Background
Click the ![]() next to Background to set the
label background properties. The Background
is the area behind the label. Click the
next to Background to set the
label background properties. The Background
is the area behind the label. Click the  next to Line
to set the line properties for the line that goes around the text.
Click the next
to Fill to set the fill properties
for the area around the text.
next to Line
to set the line properties for the line that goes around the text.
Click the next
to Fill to set the fill properties
for the area around the text.
Label Position
The Label Position section includes properties for defining the label position and rotation.
Horizontal Alignment
The plot label can be positioned relative to the data point vertically, horizontally, and by specified amounts. Horizontal alignment controls the horizontal placement of the labels. You can position the labels to the Left or Right of the data point, Center the labels on the data point, or alternate the position of the labels to the left and right of neighboring data points (Alternate left-right). To change the horizontal placement of the labels, click the existing option and select the desired option from the list.
Vertical Alignment
Vertical alignment controls the vertical position of the data label. You can position the labels Above or Below the data point, Center the labels on the data point, or alternate the position of the labels above and below neighboring data points (Alternate above-below). To change the vertical placement of the labels, click the existing option and select the desired option from the list.
Label Offset
Labels can be positioned at a custom position by entering values into the X offset or Y offset boxes. Entering a positive value into the offset box moves the label up for the Y offset or to the right for the X offset. Entering a negative value in the offset box moves the label down for the Y offset or to the left for the X offset.
Angle
You can enter a number into the Angle box to rotate the data point labels. Positive values rotate the label in a counter-clockwise direction. The Angle is specified in degrees.
Label Leader Line
Label leader lines can be used to connect the text label to the data point. If the edge of the label is further than 0.1 inches (0.254 centimeters) away from the data point, label lines are displayed. This normally means that label lines are displayed if labels have been moved with the Move Labels command or if the X offset or Y offset values have been changed from zero. The line goes from the label to the point. Line properties can be changed for the label lines. To change the label line properties, change the properties in the Label Leader Line Properties section of the Line page.
Tips for Configuring Labels on Ternary Diagrams
A common way to portray labels on a ternary diagram is by having the labels surrounded by parentheses.
To format the labels with parentheses:
- Select a ternary diagram plot.
- In the Property Manager, click on the Labels tab. Check the Include X value, Include Y value, and Include Z value boxes.
- Set the Label order to X, Y, Z.
- Click the
next to Format.
- Click the Editor button next to Prefix.
- In the Text Editor, type a left parenthesis and click OK.
- Click the Editor button next to Suffix.
- In the Text Editor, type a right parenthesis and click OK.
For example, for data point X=55, Y=15, Z=30, the label appears as (0.55, 0.15, 0.30) when the axes are scaled 0 to 1. When the axes are scaled 0 to 100, the label appears as (55,15,30).
Tip for Label Scale
To display the values on a 0 to 100 scale instead of 0 to 1, click on one of the axes. In the Property Manager, click on the Axis tab. In the Limits section, check the box next to the 0 to 100 scale option to display the label as (55, 15, 30).