Symbol Properties
Symbol properties can be changed for selected objects in the plot window. You can set default symbol properties through the File | Options command. In the Options dialog, click on Symbol in the Defaults section to access these defaults. Changes made in the Options dialog affect all subsequent documents. Custom symbols can be created using a third-party TrueType font editing software.
To change the symbol properties on a plot, click on the plot in the Object Manager or the plot window to select it. The plot properties are displayed in the Property Manager.
The Symbol page in the Property Manager contains the properties for all symbols in the plot. For example, a line/scatter plot Symbol page will include a Plot Symbol Properties section. If average value error bar symbols are displayed, then the Symbol page will also include an Average Value Symbol Properties section.
|
|
|
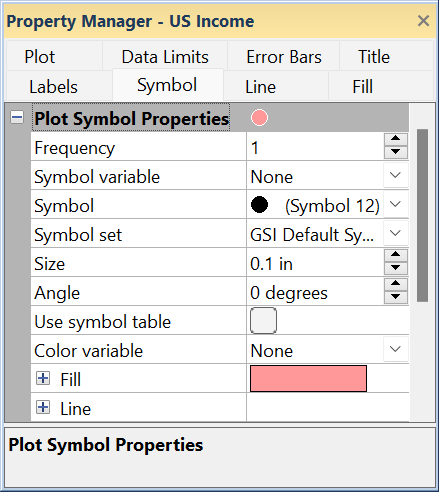
The symbol properties are set in the Property Manager on the Symbol tab. |
Symbol Frequency
The Frequency option allows you to specify how often a symbol appears on the plot. For example, set the Frequency value to 2 to display a symbol at every other data point on a graph. Change the Frequency value to 3 to display a symbol at every third data point on the graph. The Frequency can be any number between 0 and 2147483647. The plot automatically updates to show the new frequency.
Symbol Variable
The Symbol variable option allows you to select symbols from a specific column or row in the worksheet. To select a Symbol variable, click on the current column name or the word None and select the desired column/row from the list. When the Symbol variable is set to None, all symbols in the plot are controlled by the Symbol properties page.
The values in the worksheet symbol column can have three forms:
- Symbol set:Index displays a symbol from a specific symbol set. The Symbol set is the font from which the symbol is selected. The Index is the symbol's index number in the font. For example, the cell value Arial:87 in the worksheet would make the symbol a lowercase "w" in the Arial font in the plot.
- Index displays a specific symbol from the symbol set specified in the Symbol set field in the Symbol page. The default symbol set is GSI Default Symbols. For example, a cell value of 12 in the worksheet would set the symbol to a filled circle if the Symbol set is set to GSI Default Symbols in the Property Manager.
- An empty cell displays the symbol specified by the Symbol and Symbol set properties in the Symbol page.
The symbol index value is the symbol number as it appears in the Symbol properties Symbol field. This is the 0-based offset of the symbol within the symbol set. To use the symbol index in a data column, use the value displayed in the Symbol properties. The symbol index value is the ASCII code minus 32. For example, the ASCII code for the Arial font uppercase A is 65. The index value displayed in the symbol properties and used in the symbol column is 33.
You can use the Windows character map utility to determine the ASCII code for font symbols, and you can then subtract 32 from the ASCII code to determine the index value. However, it is generally faster to obtain the index value directly from the Symbol page Symbol property. Note that the character map utility displays ASCII codes in hexadecimal. For example, U+0041 is displayed in the Windows Character Map for uppercase A. Convert the hexadecimal value 0x41 to a decimal value: 4 x 16 + 1 = 65. This value, 65, is the ASCII code in decimal notation. The Index value is 33 (65 - 32 = 33).
Symbol
The Symbol is the symbol that is displayed on the plot when the Symbol frequency value is greater than 0. To change the Symbol , click on the existing symbol. The symbol palette is displayed. Click on the new symbol. The plot is automatically updated to show the new symbol.
The symbol number is indicated in the title bar above the symbol palette and adjacent to the Symbol in the Property Manager. The symbol number is the 0-based offset of the symbol within the symbol set. The symbol number is used in a column when the Symbol column option is enabled.
Symbol Set
The Symbol set displays the font that is currently used for the symbol. To change the Symbol set, click on the existing symbol set name. In the list, select a new font from the list. All TrueType fonts are listed in the Symbol set.
Size
The Size controls the symbol size. This is the size of the full symbol box, not just the symbol. Symbol sizes are between 0.0 and 4.0 inches (0.0 and 10.16 centimeters) and are shown in page units.
Note that the symbol Size is affected by the line Width setting. When you change the Size value only the symbol size changes. However, if you deselect the symbol and select the object again, the Size value updates automatically to display the symbol Size value plus the line Width value, i.e., the overall size of the symbol. Consider the two following examples: You desire a symbol Size of 0.200 inches with a line Width of 0.005 inches. If you enter these values into the respective property fields, the overall symbol size will be 0.205 inches. Now you desire a symbol with a line width of 0.005 inches and overall symbol size of 0.200 inches. Then you must enter 0.195 in the Size field and 0.005 in the Width field. The overall symbol size will be 0.200 inches.
Symbol Angle
The Angle property controls the symbol rotation. Enter a value between -360 and 360 to rotate the symbol. Positive values rotate the symbol counterclockwise, and negative values rotate the symbol clockwise. The Angle is specified in degrees.
Use Symbol Table
Check the box next to Use symbol table to determine the symbol based on a symbol table. The Symbol table option becomes active. Uncheck the box next to Use symbol table to turn off the symbol table functionality. The symbol table option allows symbols to change from one point to the next based on a table of symbols. A symbol table can also allow different symbols for each point or allow for repeating symbols.
Symbol Table
Click the Set button next to the Symbol table option to open the Symbol Table dialog and control which symbols are used in the plot.
Show Symbol Table Legend
Select the Show symbol table legend property to display a legend for the symbol table. Clear the box to remove the legend.
Fill Color Variable
Symbols can be assigned fill colors from a data color column. Select the color column in the Color variable list to apply symbol fill colors from the worksheet. The fill style is automatically set to Solid when a Color variable is used.
Mapping Colors to Numeric Values
When the selected color variable includes numeric data, the data are mapped to a color gradient and the color mapping is applied to the symbols. Select a predefined color gradient in the Colormap list or click the  button to set the color gradient in the Color Gradient dialog.
Specifying Colors in the Worksheet
When the selected color variable includes text data, the colors are specified by Predefined color name or RGB value.
Colors can be specified in the worksheet by many different methods. The table below provides some examples, where <r>, <g>, <b>, and <a> are red, green, blue, and alpha values between 0 - 255, and <color> is a predefined color name as it appears in the color palette. An alpha value of 0 is fully transparent and 255 is fully opaque.
| Method | Example |
| <color> | Red |
| <color>:<a> | Red:255 |
| RGB(<r>,<g>,<b>) | RGB(255,0,0) |
| RGB(<r>,<g>,<b>,<a>) | RGB(255,0,0,128) |
| \COLOR(<r>,<g>,<b>,<a>) | \COLOR(255,0,0,255) |
| R<r> G<g> B<b> | R255 G0 B0 |
| R<r> G<g> B<b> A<a> | R255 G0 B0 A255 |
| \RGBR<r> \RGBG<g> \RGBB<b> | \RGBR255 \RGBG0 \RGBB0 |
| \RGBR<r> \RGBG<g> \RGBB<b> \RGBA<a> | \RGBR255 \RGBG0 \RGBB0 \RGBA180 |
Apply Color Variable to Fill or Fill and Line
The Apply color variable to property specifies whether the fill color variable is applied to only the symbol fill color or both the symbol fill and line colors. Select Fill to apply the color variable to the symbol fill. Select Fill and Line to apply the color variable to both symbol fill and line colors.
Show Color Scale
The Show color scale property is displayed when a numeric Color variable is used for the symbol fill colors. Select the Show color scale property to display a color scale bar in the plot window. Clear the Show color scale property or delete the color scale to remove it from the plot window.
Fill Properties
The Fill controls the inside
color, opacity, and pattern of the symbol, when the selected symbol is
a filled symbol. To change the Fill
properties of the symbol, click the ![]() next to Fill to open the Fill section. Set the Pattern,
Foreground color, Foreground opacity, Background color, Background opacity,
Stretch, and Scale for the inside portion of the filled symbol. Refer to the Fill
Properties page for information about the various fill options.
next to Fill to open the Fill section. Set the Pattern,
Foreground color, Foreground opacity, Background color, Background opacity,
Stretch, and Scale for the inside portion of the filled symbol. Refer to the Fill
Properties page for information about the various fill options.
Note that 3D plots do not support symbol fill properties. A Color and Opacity option are available to control the symbol color and opacity for 3D symbols.
Line Properties
The Line controls the outside
edge of the symbol. To change the symbol Line
properties, click the ![]() next to Line
to open the Line section. Set
the Style, Color, Opacity, and
Width for the edge of the symbol.
Note that 3D plots do not support symbol outline colors. Refer to the
Line Properties page for information
about the various options.
next to Line
to open the Line section. Set
the Style, Color, Opacity, and
Width for the edge of the symbol.
Note that 3D plots do not support symbol outline colors. Refer to the
Line Properties page for information
about the various options.