Plot Page - Ternary Diagrams
The ternary diagram plot properties Plot page contains the options to change the data file and set data used in the plot. To view and edit ternary diagram plot properties, click on the ternary diagram plot in the plot window or Object Manager to select it. Then, click on the Plot tab in the Property Manager.
|
|
|
Change the ternary diagram plot properties in the Property Manager on the Plot tab. |
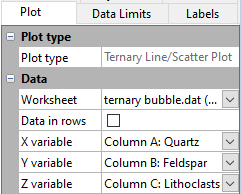
Plot Type
The Plot type property displays the type of plot.
Worksheet
Click the existing data file path and file name next to Worksheet to select a different data file for the plot. Click on a currently open worksheet or click the Browse option to navigate to a worksheet that is not yet open. Select a different data file in the Open Worksheet dialog, and click the Open button to change the data. The plot automatically updates.
NOTE: The worksheet columns are retained after changing the worksheet. If any of the column options are blank after changing the Worksheet, click on the blank option and select the desired column. A blank next to column means that the column does not exist in the new worksheet.
Data in Rows
Select the Data in rows option if your data file is formatted where each row includes one variable. When the Data in rows option is selected, all plot properties that require data values are specified by selecting a data row. This includes variables such as X and Y, data labels, worksheet ranges, etc. Properties that list column letters will update to list row numbers. When switching from plotting data in columns to plotting data in rows, Grapher may not be able to select the correct rows automatically. Verify the correct rows are selected.
The property descriptions below refer to data columns, but when Data in rows is selected the property lists will include rows.
Data
Click on the column name next to the X variable, Y variable, and Z variable fields to change the columns used to create the plot. In the list that appears, select the new column. If the first worksheet row contains header information, the header information appears next to the column letter.
In ternary diagrams, the three data columns for the X, Y, and Z fields must be normalized so that their sum is 1.0 or 100, i.e., 100 percent. Data that is not normalized to 1 or 100 is automatically normalized by Grapher when it is plotted. For example, values of 0.50, 0.75, and 0.25 would plot as 0.33, 0.50, and 0.17, respectively.
- In the X variable list, select the data column to plot along the X axis. 100 percent is at the lower right corner.
- In the Y variable list, select the data column to plot along the Y axis. 100 percent is at the upper corner.
- In the Z variable list, select the data column to plot along the Z axis. 100 percent is at the lower left corner.
NOTE: The worksheet columns are retained after changing the worksheet. If any of the column options are blank after changing the Worksheet, click on the blank option and select the desired column. A blank next to column means that the column does not exist in the new worksheet.