Plot Page - Line, Scatter, and Line/Scatter Plots
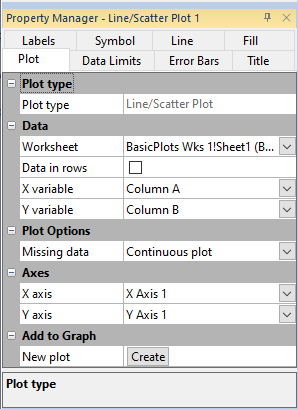
The line, scatter, and line/scatter plot properties Plot page contains the options to change the data file and axes; create fit curves in the plot; and add a new plot to the graph. To view and edit line/scatter plot properties, click on the line/scatter plot in the plot window or Object Manager to select it. Then, click on the Plot tab in the Property Manager. To review the properties of fit curve lines see the Plot Page - Fit Plots properties page.
|
|
|
Change the line/scatter plot properties in the Property Manager on the Plot tab. |
Plot Type
Plot type
The Plot type property displays the type of plot.
Data (not displayed for fit curves)
Worksheet
Click the existing data file path and file name next to Worksheet to select a different data file for the plot. Click on a currently open worksheet or click the Browse option to navigate to a worksheet that is not yet open. Select a different data file in the Open Worksheet dialog, and click the Open button to change the data. The plot automatically updates.
NOTE: The worksheet columns are retained after changing the worksheet. If any of the column options are blank after changing the Worksheet, click on the blank option and select the desired column. A blank next to column means that the column does not exist in the new worksheet.
Data in Rows
Select the Data in rows option if your data file is formatted where each row includes one variable. When the Data in rows option is selected, all plot properties that require data values are specified by selecting a data row. This includes variables such as X and Y, data labels, worksheet ranges, etc. Properties that list column letters will update to list row numbers. When switching from plotting data in columns to plotting data in rows, Grapher may not be able to select the correct rows automatically. Verify the correct rows are selected.
The property descriptions below refer to data columns, but when Data in rows is selected the property lists will include rows.
X variable
Click on the column name next to the X variable field to change the columns used to create the plot. In the list that appears, select the new column. If the first worksheet row contains header information, the header information appears next to the column letter.
When changing the X variable to numeric data from date/time data, the Use date/time format option for the corresponding axis Tick Labels will automatically be unchecked to match the new data.
NOTE: The worksheet columns are retained after changing the worksheet. If any of the column options are blank after changing the Worksheet, click on the blank option and select the desired column. A blank next to column means that the column does not exist in the new worksheet.
Aside from the columns containing data there are two other options, row number and sequence number. These options are available in the list that appears before the first column.
-
Selecting the Row number option plots the axis with the row numbers used in the Worksheet rows section. For example, if the first row is number two, the axis begins at a value of two.
-
The Sequence number option plots the data according to the total number of rows used. The sequence number always begins with the number one regardless of which rows are selected in the Worksheet rows group. Blank lines between rows are ignored when calculating the value. The sequence number increments by one when rows are adjacent or when rows are skipped.
Y Variable
Click on the column name next to the Y variable field to change the columns used to create the plot. In the list that appears, select the new column. If the first worksheet row contains header information, the header information appears next to the column letter.
When changing the Y variable to numeric data from date/time data, the Use date/time format option for the corresponding axis Tick Labels will automatically be unchecked to match the new data.
NOTE: The worksheet columns are retained after changing the worksheet. If any of the column options are blank after changing the Worksheet, click on the blank option and select the desired column. A blank next to column means that the column does not exist in the new worksheet.
Aside from the columns containing data there are two other options, row number and sequence number. These options are available in the list that appears before the first column.
-
Selecting the Row number option plots the axis with the row numbers used in the Worksheet rows section. For example, if the first row is number two, the axis begins at a value of two.
-
The Sequence number option plots the data according to the total number of rows used. The sequence number always begins with the number one regardless of which rows are selected in the Worksheet rows group. Blank lines between rows are ignored when calculating the value. The sequence number increments by one when rows are adjacent or when rows are skipped.
Z variable (only displayed for XYZ Line/Scatter plot)
Click on the column name next to the Z variable field to change the columns used to create the plot. In the list that appears, select the new column. If the first worksheet row contains header information, the header information appears next to the column letter.
When changing the Z variable to numeric data from date/time data, the Use date/time format option for the corresponding axis Tick Labels will automatically be unchecked to match the new data.
NOTE: The worksheet columns are retained after changing the worksheet. If any of the column options are blank after changing the Worksheet, click on the blank option and select the desired column. A blank next to column means that the column does not exist in the new worksheet.
Aside from the columns containing data there are two other options, row number and sequence number. These options are available in the list that appears before the first column.
-
Selecting the Row number option plots the axis with the row numbers used in the Worksheet rows section. For example, if the first row is number two, the axis begins at a value of two.
-
The Sequence number option plots the data according to the total number of rows used. The sequence number always begins with the number one regardless of which rows are selected in the Worksheet rows group. Blank lines between rows are ignored when calculating the value. The sequence number increments by one when rows are adjacent or when rows are skipped.
Plot Options
Missing Data
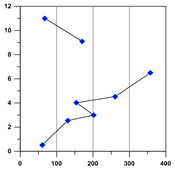
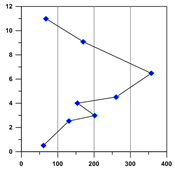
Rows containing text or blanks in the plotted columns are ignored and are not plotted on the graph. You can display the missing data as part of a continuous or discontinuous line using the Missing data options. Setting Missing data to Continuous plot connects the data line before and after the missing data. Setting Missing data to Discontinuous plot breaks the line at the missing data sections of the data set. Data filtered using a Data Filter are included as missing data. Missing data is not available for all plot types.
|
|
|
|
This plot has the Missing data option set to Discontinuous plot. The line breaks across the missing data point. |
This plot has the Missing data option set to Continuous plot. The line continues and does not break across the missing data point. |
Axes
Click on the axis name next to the X axis, Y axis, or Z axis fields to change the axes used for the plot. Select another axis name from the list. Alternatively, click Select plots/axis to change the axis used by several plots on a graph at once.
See the Axis - Add to Graph page for information about how to add a new axis to the graph. Once the new axis is added to the graph, it will be available in the X axis, Y axis, or Z axis lists.
3D Settings (only displayed for XYZ line/scatter plot)
The 3D Settings section is displayed for an XYZ line/scatter plot and includes options for displaying drop lines and plot projections.
Vertical drop lines
When the Vertical drop lines box is checked, you can choose the plane to which the lines are drawn. Drop lines are drawn from the data point to the plane that intersects the drop axis minimum.
Vert drop axis (only visible when Vertical drop lines field is checked)
When the box next to the Vertical drop lines option is checked, lines are drawn from the points to the bottom wall (XZ plane). For vertical drop lines, the XZ plane to which the drop lines are drawn is specified by the Vert drop axis minimum location.
Horizontal drop lines
When the box next to the Horizontal drop lines option is checked, lines are drawn from the points to the bottom wall (XZ plane). For vertical drop lines, the XZ plane to which the drop lines are drawn is specified by the Vert drop axis minimum location.
Horiz drop axis (only visible when Horizontal drop lines field is checked)
When the box next to the Horizontal drop lines option is checked, lines are drawn from the point to the side wall (YZ plane). For horizontal drop lines, the YZ plane to which the drop lines are drawn is specified by the Horz drop axis minimum location.
Z drop lines
When the box next to the Z drop lines option is checked, lines are drawn from the point to the back wall (XY plane).
Line frequency (only visible when any drop lines field is checked)
If there are many drop lines, you can change the frequency the lines are drawn by entering a new number into the Line frequency box. For example, if Line frequency is set to 5, every fifth line is plotted on the plot. To remove all of the lines, set the Line frequency to a number greater than the total number of data points. Up to 10,000 points may be skipped.
To define the drop line properties
The drop line properties
can be individually controlled with the Vert
drop line properties, Horz drop
line properties, and Z drop line
properties sections on the Line
page. Click the  next to the appropriate section to open the line properties options. The
Style, Color, Opacity, and Width can be changed for the drop
lines.
next to the appropriate section to open the line properties options. The
Style, Color, Opacity, and Width can be changed for the drop
lines.
Projection Lines
Projection lines are also available for 3D XYZ plots. Projection lines are 2D representations of the 3D lines and appear on the various axis walls. Check the boxes next to the Back projection, Side projection, or Bottom projection options to add one, two, or all three of these projection lines to the graph. The Back projection option places the XY projection on the back wall of the graph. The Side projection option places the YZ projection on the side wall. The Bottom projection places the XZ projection on the bottom wall.
To define the projection line properties
The projection line properties
can be controlled in the Projection
line properties section on the Line
page. Click the
next to the Projection line properties
section to open the line properties options. The Style,
Color, Opacity, and Width
can be changed for the projection lines.
Statistics (only displayed for fit curves)
Click the Graph Tools | Add to Graph | Fit Curve command to add a fit curve to the graph. This adds a linear fit by default. Many fit types are available. To review the properties of fit curve lines see the Plot Page - Fit Plots properties page.
Add to Graph
Click the Create button next to the New plot command to create a new plot based on the current data file. A new plot is created using the same X variable as the selected plot. The Y variable changes to the next column in the worksheet that contains data. For example, if a selected line/scatter plot uses column A for the X variable and column B for the Y variable, clicking the Create button generates a new line/scatter plot with column A for the X variable and column C for the Y variable.
The new line/scatter plot is selected so you can change the new plot's properties. The line, fill, and/or symbol color follow the settings already set on the plot. If you don't want added plots with the Create button to follow the original plot settings you can update the File | Options dialog window, on the Plots tab, on the Ignore plot palette for line/scatter plots field.