Data Filter
A method to apply a data filter to plot data is available in all plots that use data files as input (except Radar and Stiff plots). Filters are built in the Data Filter dialog, which allows creation of multiple inclusion and/or exclusion filters for each plot. Boolean operators and built-in mathematical functions can be used when creating filters. A data filter can be applied to one or more plots of the same type, for example one data filter can be applied to all bar charts in the same plot window.
|
|
|
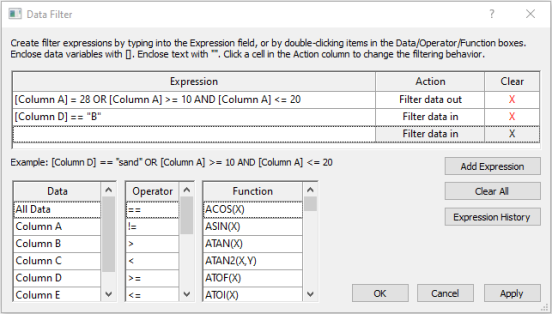
Example Data Filter Dialog |
Follow these steps to open the Data Filter dialog and define a data filter:
- In the Object Manager, select one or more plots to which you want to apply the filter. The data filters will be applied to all selected plots.
Tip: You may find it useful to right click the plot in the plot window or the Property Manager and select Display Worksheet so you can review the data and column structure.
- For pie and doughnut plots, click the Plot property page. For all other plots that allow a data filter, click the Data Limits property page.
- Click the Filter button in the Data filter property. The Data Filter dialog will appear. If the Filter button is not active, then you may have selected plots that are not similar enough to each other to apply the same data filter. Select one plot at a time to create their data filters.
- In the Data Filter dialog, click the Add Expression button to create a new row in the Expression section near the top of the Data Filter dialog.
- To build a filter expression:
- Type directly into the Expression field and/or double click values from the Data, Operator, and Function lists to add those values to the new Expression field.
- Edit the expression in the Expression field. Expressions can be simple and have just one operator, or they can be complex and have a combination of operators, parenthetical evaluations, and multiple "and/or" values.
Tip: Use Julian dates for date/time data. For example the date/time "6/29/2021 14:20" is 44376.597222222 in the Julian date/time format.
- Select a previously built expression by clicking the Expression History button, selecting it, and clicking OK.
- Click the X in the Clear column to delete an unneeded expression.
Tip: If you are not familiar with filtering data, it is recommended to build one filter expression at a time and test it to make sure it is filtering the data as expected. For example, move the Data Filter dialog so you can see the selected plot in the plot window. After creating a filter expression, click the Apply button to see what data remains after applying the filter.
- Select either Filter data in or Filter data out from the Action list. The Filter data in option will plot only the data that match the filter condition; whereas Filter data out filters out data that matches the filter condition.
- Continue to build all needed filter expressions, by first clicking the Add Expression button for a new expression field and then building the terms of the filter expression.
- To close the Data Filter dialog, click OK to apply all defined filter expressions or click Cancel to not apply any changes.
See Also
SetDataFilter (automation)