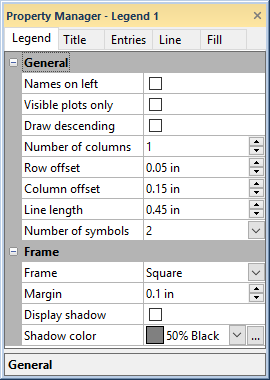
Legend Properties
The Legend tab controls the legend properties. This section is used to set the legend options including adding plots and entering a legend title. To edit the legend properties, click on a legend to select it. The selected legend properties appear in the Property Manager.
|
|
|
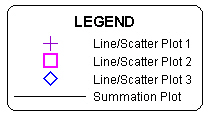
Set the legend properties on the Legend tab in the Property Manager. |
Names on Left
Check the Names on left option to display the legend names to the left of the symbols. When this option is not checked, the item name appears to the right of the symbols and lines.
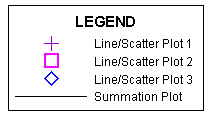
This legend has the Names on left
and a drop shadow of 10% Black.
Visible Plots Only
Check the Visible plots only option to only include legend entries for visible plots. Plot visibility is controlled in the Object Manager. The legend automatically updates when a plot visibility is changed.
When the Visible plots only option is not checked, entries can be removed in the Legend Entries dialog. Entries removed in the Legend Entries dialog will not be recreated when the plot visibility changes.
Draw Descending
Check the Draw descending option to flip the order of the legend entries. When Draw descending is checked, the order of entries in the legend matches the order of the plots in the Object Manager when the legend is created. If the plot order is changed after the legend is created, the entry order will not automatically change. The entries can be ordered manually in the Legend Entries dialog. When the Draw descending option is not checked, the legend entries are ordered by draw order, i.e. the bottom plot in the Object Manager is the first legend entry.
Number of Columns
The Number of columns changes how many columns are used to display all the items in the legend. Select a value between 1 and 100 for the Number of Columns to change how many columns are shown in the legend.
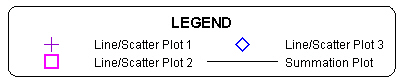
This legend has two columns.
Row Offset
Enter a value for Row offset to add space between rows of legend items. The Row offset is measured in page units and is any value between 0 and 1 inches (0 and 2.54 centimeters).
Column Offset
Enter a value for Column offset to add space between columns of legend items. The Column offset is measured in page units and is any value between 0 and 1 inches (0 and 2.54 centimeters).
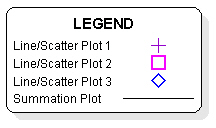
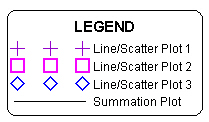
Number of Symbols
You can set the number of symbols in the legend using the Number of symbols list. To change the Number of symbols, click on the existing option and select the new option from the list. The list contains options to display 0, 1, 2, or 3 symbols.
|
|
|
|
This legend has three symbols. |
This legend has one symbol. |
Frame
The legend Frame defines the how the corners on the outside of the legend box are drawn. To change the Frame, click on the existing option and select a new option from the list. The Frame can be rounded or square. The frame fill properties are located on the Fill page. The frame line properties are located on the Line page.
|
|
|
|
This legend has rounded corners. |
This legend has square corners. |
Margin
The amount of space between the text and the legend frame is set through the Margin box. The Margin is measured in page units and can be any number between 0 and 1 inches (0 and 2.54 centimeters).
Display Shadow
Check the box next to Display shadow to add a shadow effect behind the legend.
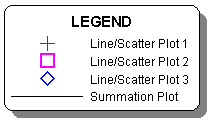
This legend has a drop shadow
with a shadow color of 50% Black.
Shadow Color
Click the color display next to Shadow color to open the color palette. Select a color for the display shadow and the legend will automatically update.
Entries
The Entries section specifies which classes, bins, or plots are included in the legend. For chart slice legends, the Entries section controls the entry labels.
Legend and Class Legend Entries
You can set the multi-graph legend or legend plot names, change the symbol sizes or font, and add or remove plots from a legend by clicking the Edit button next to Entries. You can set the class legend class names, symbol sizes, and entry font by clicking the Edit button next to Entries. These options are changed in the Legend Entries dialog.
Wind Legend Entries
A wind legend entry is displayed for each speed bin. A bin color sample is displayed next to the bin lower and upper limits. The Entries section includes the font properties for the entries.
Chart Slice Entries
A chart slice legend entry is displayed for each pie or doughnut slice. A slice color sample is displayed next to the user-specified label. The entry label can be the From worksheet, Data value, or Percentage label from the pie or doughnut plot Labels page.
Default Legend Settings
Items such as default graph titles, line styles, and fill patterns can be set by creating a template graph. All legend settings including the symbol size and preference for plot-sized symbols can be saved as a preference with the File | Defaults command and selection of Legend on the left side of the dialog.