Legend Entries
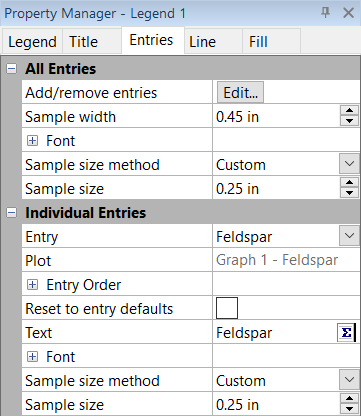
Set the legend entry plot names, change the legend entry symbol sizes, and add or remove plot entries from a legend in the Entries page in the Property Manager.
|
|
|
Set the properties for all entries or for each entry in the Entries page. |
All Entries
Properties in the All Entries section apply to all legend entries. Wind legends and chart slice legends have only an Entries section for all entries.
Reorder/Select Entries
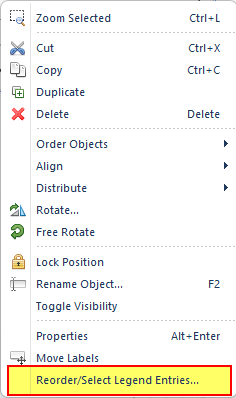
Click Edit in the Reorder/Select Entries field to select the entries to be displayed in the legend. The Reorder/Select Entries dialog allows you to choose the plots to be included and adjust the entry order directly within the Reorder/Select Entries dialog. You can also open this dialog by right clicking directly on a legend in the plot window, and selecting Reorder/Select Legend Entries... from the context menu.

Right click on a legend to open the context menu,
then select 'Reorder/Select Legend Entries' to open the dialog.
Sample Width
Specify the width of the lines and bars or the distance between symbols in the legend in the Sample width field.
Uniform Sample Width
When the Uniform sample width is selected, the lines and bars in the legend have the same size. Clear the Uniform sample width option to specify the width of individual lines and bars in the legend.
Label
For pie chart legends, set the Label to None, From worksheet, Data value, or Percentage for the chart slice legend labels.
- The None option hides the label.
- The From worksheet option uses the Labels column.
- The Data value displays the value in the Data column.
- The Percentage calculates the percentage this slice is of the entire pie chart and displays the percentage value.
Font
Click the ![]() next to Font to set the legend
entry font properties for
all legend types.
next to Font to set the legend
entry font properties for
all legend types.
Format
Click the ![]() next to Format to set the chart
slice legend entry label format properties.
next to Format to set the chart
slice legend entry label format properties.
Background
Click the ![]() next to Background to set the
chart slice legend entry background properties. The Background
is the area behind each entry.
next to Background to set the
chart slice legend entry background properties. The Background
is the area behind each entry.
Sample Size Method
The Sample size method changes the size of the symbols in the legend.
- Fixed symbols are fixed at a program default size.
- Plot size displays the graphed symbol size. If the graphed symbol size changes, the legend symbol size changes as long as the Graphs | Legend | Detach command is not used.
- Custom displays custom symbol sizes in the legend. When the Sample size method is set to Custom, specify the symbol size in the Sample size field.
Individual Entries
The properties in the Individual Entries section apply only to the selected entry. Each entry can have different properties. Wind and chart slice legends do not have an individual entries section.
Entry
Select the entry to edit in the Entry list.
Plot
The Plot is a read-only value that indicates which graph and plot entry is being edited.
Text & font defaults
The Reset button is initially disabled and appears in a grayed-out state. It becomes active once changes have been made to either the text field or font properties, clicking the button in its active state will revert the text field and font properties to their default state at any time.
Text
Specify the text for the legend entry, to edit this type into the text field or use the Text Editor button.
Moving the Legend Entry Labels
The legend title and entries can be moved with the Graph Tools | Plot Tools | Move Labels command.
- Select the legend in the plot window or Object Manager.
- Click Graph Tools | Plot Tools | Move Labels.
- Click and drag the legend title and/or entries to the desired locations.
- Press ESC to end Move Labels mode.
