Labels Page - Pie Charts and Doughnut Plots
Data point labels can be shown on most plot types in Grapher. For pie charts and doughnut plots, the labels can show the information in the labels column, data values, or the percentage the data value is of the whole pie. Labels can also be customized to appear in specific locations and can use a variety of formats, fonts, and colors to optimize the look and feel of the graph.
Pie charts and doughnut plots are automatically labeled with two labels. The top label is the text in the worksheet's label column. The second label is the percentage of the pie for that slice. Either label can be altered to display data value, as well.
The following information is for the options contained on the pie chart and doughnut plots Labels tabs. To edit the labels, click on a pie chart or doughnut plot to select it. In the Property Manager, click on the Labels tab.
|
|
|
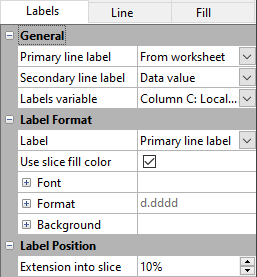
Set label properties in the Property Manager on the Labels tab. |
Labels
Set the Primary line label and Secondary line label to one of the following values:
- The None option hides the label.
- The From worksheet option uses the Labels variable.
- The Data value displays the value of the Data variable (see the Plot page).
- The Percentage calculates the percentage this slice is of the entire pie chart and displays the percentage value.
Label Format
The Label Format section includes the font, format, and background options for the labels.
Label
Select the label you wish to edit in the Label field. Select Primary line label to edit the font, format, and background properties for the first label. Select Secondary line label to edit the font, format, and background properties for the second label.
Use Slice Fill Color
Check the box next to the Use slice fill color command to color the labels with the same color as the foreground color of the slice.
Label Font
Click the ![]() next to Font to set the label
font properties. The font
Face, Size (points), Color, Opacity,
Bold, Italic, Underline, and Strikethrough properties can be set for most labels.
next to Font to set the label
font properties. The font
Face, Size (points), Color, Opacity,
Bold, Italic, Underline, and Strikethrough properties can be set for most labels.
Label Format
Click the ![]() next to Format to set the label format properties. The label
Type, display of numbers, Prefix, and Suffix can be set for labels.
next to Format to set the label format properties. The label
Type, display of numbers, Prefix, and Suffix can be set for labels.
Label Background
Click the ![]() next to Background to set the
label background properties. The Background
is the area behind the label. Click the
next to Background to set the
label background properties. The Background
is the area behind the label. Click the  next to Line
to set the line properties for the line that goes around the text.
Click the
  next
to Fill to set the fill properties
for the area around the text.
Label Line
Label lines can be used to connect the text label to the slice. Line properties can be changed for the label leader lines on the Line page.
The Extension into slice option determines the distance the label line extends into the slice. For example, a distance of 50 percent extends the line halfway into the slice, toward the center of the chart.
