Color Scale - Contour Maps
A color scale is a legend that shows the colors used in a contour map.

This contour map has a color scale
to display the Z value of the colors.
Adding a Color Scale
To add a color scale to a contour map, first select the contour map in the Object Manager or plot window. In the Property Manager, click the Plot tab. Check the box next to the Fill contours command. Finally, check the box next to the Show color scale command to create the color scale. The color scale appears next to the contour map in the plot window.
Removing a Color Scale
To remove a color scale, click on the contour map to select it. In the Property Manager, click on the Plot tab. Uncheck the box next to the Show color scale command.
Adding and Editing a Title
Click the Title tab to add a title and edit the title properties.
Editing a Color Scale
To modify the color scale, click on the color scale in the Object Manager or plot window. The properties for the color scale are displayed in the Property Manager. Click the Labels tab to access the color scale's label properties. There are three tabs: Labels, Title, and Line. The Labels tab options are described below.
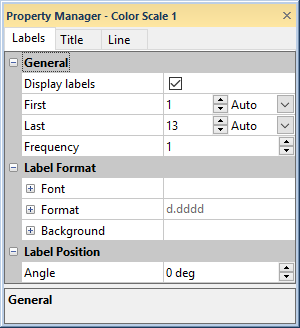
Set the color scale bar properties on
the Labels tab in the Property Manager.
Display Labels
Check the box next to the Display labels command to turn the scale labels on or off.
Label Range
The First and Last values define the contour interval for the first and last labels on the color scale. The values for the First and Last are incremental where 1 is the first line at the bottom of the color scale, 2 is the next line, 3 the third line, etc.
If Auto is selected for the First and Last, Grapher automatically determines the first and last value that is labeled for the color scale. To limit the range of labels, click the word Auto and select Custom. You can then enter a new value into either the First or Last boxes.
Click the word Custom and select Auto to go back to automatic values. The word Auto will appear and the First or Last will revert to the default values.
Use the Frequency to skip labels in the color scale. For example, if Frequency is set to five, every fifth line contains a label between the First and Last plotted labels. When Frequency is set to one, every data line on the color scale is labeled.
Label Font
Click the ![]() next to Font to set the label
font properties. The font
Face, Size (points), Color, Opacity,
Bold, Italic, Underline, and Strikethrough properties can be set for most labels.
next to Font to set the label
font properties. The font
Face, Size (points), Color, Opacity,
Bold, Italic, Underline, and Strikethrough properties can be set for most labels.
Label Format
Click the ![]() next to Format to set the label format properties. The label
Type, display of numbers, Prefix, and Suffix can be set for labels.
next to Format to set the label format properties. The label
Type, display of numbers, Prefix, and Suffix can be set for labels.
Label Background
Click the ![]() next to Background to set the
label background properties. The Background
is the area behind the label. Click the
next to Background to set the
label background properties. The Background
is the area behind the label. Click the  next to Line
to set the line properties for the line that goes around the text.
Click the next
to Fill to set the fill properties
for the area around the text. Label Angle
next to Line
to set the line properties for the line that goes around the text.
Click the next
to Fill to set the fill properties
for the area around the text. Label Angle
You can enter a number into the Angle box to rotate the labels. Positive values rotate the label in a counter-clockwise direction. The Angle is specified in degrees.