Color Scale - Surface Maps, Vector Plots, Color Mapped Symbols
A color scale is a legend that shows the colors used in a surface map, vector plot, or color mapped symbols in a scatter plot.
Adding a Color Scale
To add a color scale to a surface map, check the box next to the Show color scale option on the Plot page to activate the color scale. To add a color scale to a vector plot, check the box next to Show color scale on the Line page to activate the color scale. To add a color scale to a scatter plot, check the box next to Show color scale on the Symbol page. The color scale appears next to the surface map or vector plot in the plot window.
Removing a Color Scale
To remove a color scale, clear the Show color scale box in the Property Manager or clear the Color Scale visibility check box in the Object Manager.
Adding and Editing a Title
Click the Title tab to add a title and edit the title properties.
Editing a Color Scale
To modify the color scale, click the color scale name in the Object Manager to display its properties in the Property Manager. Click the Labels tab to access the color scale's label properties. There are three tabs: Labels, Title, and Line. The Labels tab options are described below.
|
|
|
The Labels tab controls the display options of the color scale bar for a surface map or vector plot. |
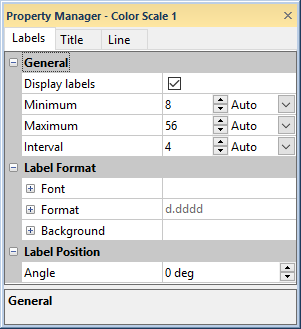
Display Labels
Check the box next to Display labels to turn the scale labels on or off.
Label Range
Set the first label value in the Minimum box. Set the last label value in the Maximum box.
Label Interval
Define the spacing between labels in the Interval box. One draws every label, two draws every other label, etc. Choose the angle at which the labels are drawn in the Angle box. Positive values rotate the labels counterclockwise. To return to the default Interval value, click the Custom option and select Auto.
Label Font
Click the ![]() next to Font to set the label
font properties. The font
Face, Size (points), Color, Opacity,
Bold, Italic, Underline, and Strikethrough properties can be set for most labels.
next to Font to set the label
font properties. The font
Face, Size (points), Color, Opacity,
Bold, Italic, Underline, and Strikethrough properties can be set for most labels.
Label Format
Click the ![]() next to Format to set the label format properties. The label
Type, display of numbers, Prefix, and
Suffix can be set for labels.
next to Format to set the label format properties. The label
Type, display of numbers, Prefix, and
Suffix can be set for labels.
Label Background
Click the ![]() next to Background to set the
label background properties. The Background
is the area behind the label. Click the
next to Background to set the
label background properties. The Background
is the area behind the label. Click the  next to Line
to set the line properties for the line that goes around the text.
Click the next
to Fill to set the fill properties
for the area around the text.
next to Line
to set the line properties for the line that goes around the text.
Click the next
to Fill to set the fill properties
for the area around the text.
Label Angle
You can enter a number into the Angle box to rotate the labels. Positive values rotate the label in a counter-clockwise direction. The Angle is specified in degrees.