Three-Minute Tour
We have included several sample files with Grapher so that you can quickly see some of Grapher's capabilities. Only a few example files are discussed here, and these examples do not include all of Grapher’s many plot types and features. The Object Manager is a good source of information as to what is included in each file.
To display the sample file, click either the Open or the Open Project buttons. Repeat this process as needed to view all the files that are of interest to you. Then, to change the properties of objects, select the relevant elements of the graph, axes, and plots either by clicking them in the document or in the Object Manager, and then adjust their settings using the Property Manager.
When you open Grapher you can access the Sample Files in the Files list of the Welcome to Grapher dialog. After you have opened Grapher you can access these Sample Files with Home | Templates | Template Gallery. The Template Gallery allows you to browse through multiple sample templates at once, filter which templates are displayed by selecting a specific Category or enter a plot type or keyword in the Search field. When you open a template the sample file will open in one tab and a template of that sample will open in another tab.
|
|
|
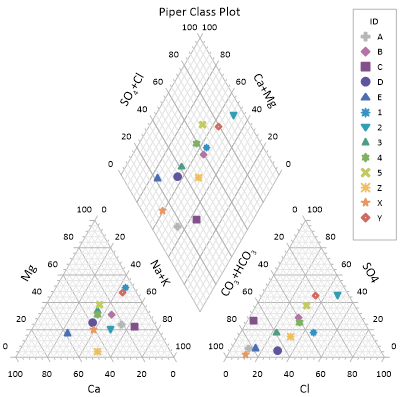
The piper class plot.grf sample file provides an example piper class plot with axis and graph titles, as well as a class legend. |
Using Grapher
Graphs can be created in several ways in Grapher.
-
The Home | New Graph commands create a graph with a single plot, and then the Graph Tools | Add to Graph commands can be used to add plots and features as desired.
-
Create multiple plots. First load your data with File | Open in Worksheet to load your data, then select the columns that contain your data and use the Home | New Graph options.
-
The Graph Wizard quickly creates a new graph with one or more plots from a single data file. The Graph Wizard can also be used to add features to the graph, such as legends and titles, as well as to apply a color palette to the plots in the graph.
To progress from a data file to a finished graph:
-
Create a data file. This file can be created in Grapher's worksheet window or outside of Grapher (using an ASCII text editor or Excel, for example).
-
Click the Home tab to select a graph type directly. For instance, click the Home | New Graph | Line/Scatter | Line Plot command.
-
In the Open Worksheet dialog, select the data file, and click Open. The graph is created from the selected data file, using default graph and plot properties.
-
Adjust the graph and plot properties using the Property Manager.
Using Scripter
Tasks can be automated in Grapher using the included Scripter program or through COM Automation using languages such as C++, Python, or C#. Scripter is an integrated development environment (IDE) provided with Grapher's installation to edit and run scripts. A script is simply a text file containing a series of instructions; practically any action you can perform manually with a mouse or keyboard can be replicated via a script. This is ideal for automating repetitive tasks and consolidating workflows.
Grapher also provides a Script Recorder, accessed through the Automation | Scripts commands. This feature records your actions and generates the corresponding script, making it an excellent tool for users new to automation. For more details and example scripts, refer to the Grapher Automation help section about Scripter.
Example Script Files
Grapher comes with several example scripts (.BAS files) located in C:\Program Files\Golden Software\Grapher\Samples\Scripts. You can run these immediately or use them as templates for your own automation projects.
To run a sample script:
The quickest method is to use the Automation tab. Click Automation | Scripts | Run, select your desired .BAS file, and click Open. The script will execute, performing the automated task within Grapher.
To edit or customize a script:
While you can run a sample script in Grapher'sScript Manager, for editing, it is recommended to open the script in Scripter, the standalone IDE included with your installation.
-
Open Scripter from your Start Menu or installation folder.
-
Use File | Open to load an example script.
-
Edit the code as needed.
-
Run the script using the Script | Run command.
Note: Using Scripter is preferred for editing because it runs independently of Grapher, providing a larger view of your code and better accessibility to tools for adjusting references and debugging.