Colormap Editor
The Colormap Editor is used to assign a gradation of colors to contour levels fill, XYZ bubble plot bubble fill, and any gradient fills. The color spectrum has specific colors assigned to anchor nodes along the spectrum. Grapher automatically blends colors to produce a smooth color gradation over the color fill. After you create a color spectrum, you can save custom spectrums for later use with other plots, plot fills, or object fills. Several predefined color spectrum .CLR files are available in C:\Program Files\Golden Software\Grapher\Color Scales\ by default.
|
|
|
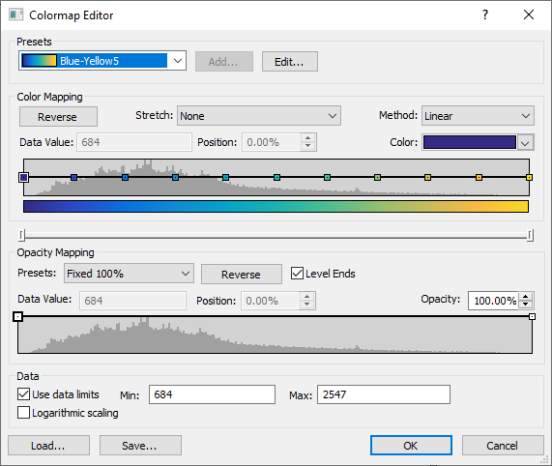
Use the Colormap Editor to assign gradient colors to a fill. |
Presets
The Presets section includes the list of presets and commands for modifying the preset color gradient list. Select a predefined .CLR file from the Presets list. When a custom colormap is displayed in the Colormap Editor, click Add to add the custom colormap to the Presets list. Click Edit to edit the Presets list in the Edit Presets List dialog.
Color Mapping
The Color Mapping section includes options for mapping specific colors to data values, distributing color anchor nodes, and interpolation methods.
Reverse
The Reverse button flips the order of colors in the colormap so that colors currently associated with low data values will be mapped to high values and colors currently associated with high values will be mapped to low values. The sample colormap updates to show the new color order.
Stretch
The Stretch field includes options to distribute colors (anchor nodes) across the colormap based on data values.
-
By default, the Stretch is set to None. When None is selected, each anchor node can be positioned independently.
-
Select Evenly Distribute to evenly distribute the anchor nodes between the data minimum and maximum. The nodes are automatically redistributed evenly when nodes are added or removed or when the data Min or Max is changed.
-
Select Equalize to distribute the nodes to improve the contrast in the map via histogram equalization. The nodes are distributed so that each histogram "bin" between nodes contain an equal number of data points. The nodes are automatically redistributed evenly when nodes are added or removed. The Equalize option is not available when a histogram is not displayed.
The Stretch option must be set to None before anchor nodes can be manually positioned.
Interpolation Method
The Method option determines which interpolation method is used to specify the colors between anchor nodes.
-
Linear interpolation uses weighted averages to interpolate colors between nodes. This linear interpolation between each color node results in a nice gradational transition and smooth appearance.
-
Reverse interpolation uses weighted averages to interpolate colors between nodes like the Linear interpolation. However, the colors are reversed between nodes. This reverse linear interpolation between each color node results in a segmented appearance.
-
Cosine interpolation uses 180 degree segments of the cosine wave. The rate of change of the color is faster than the Linear interpolation. This interpolation results in a smooth appearance.
-
Flat Start applies the color from the left node to the area between nodes. This interpolation results in a sharp transition between colors.
-
Flat Middle applies the color from the midpoint linear interpolation between the left and right nodes to the area between nodes. This interpolation results in a sharp transition between colors.
-
Flat End applies the color from the right node to the area between nodes. This interpolation results in a sharp transition between colors.
-
HSL CW interpolates the colors between nodes from the Hue-Saturation-Luminosity color wheel in a clockwise direction.
-
HSL CCW interpolates the colors between nodes from the Hue-Saturation-Luminosity color wheel in a counterclockwise direction.
-
HSL Shortest interpolates the colors between nodes from the shortest distance (clockwise or counterclockwise)on the Hue-Saturation-Luminosity color wheel between each node pair.
-
HSL Longest interpolates the colors between nodes from the longest distance (clockwise or counterclockwise)on the Hue-Saturation-Luminosity color wheel between each node pair.
Data Value and Position
The Data Value displays the data value of the selected node. The Position field displays the node's relative position in the colormap where the colormap minimum Position is 0% and the maximum is 100%. The selected node may be accurately repositioned by entering a new value in the Data Value or percentage in the Position field. The first and last nodes cannot be changed and this control is disabled when an end node is selected. To change the first and last nodes, change the Min and Max values in the Data section.
Color
Click the Color box to specify the color of the currently selected anchor node. The color palette opens.
Data Histogram
A data histogram is displayed in both the Color Mapping and Opacity Mapping sections. The histogram consists of equal width bins between the data minimum and data maximum. The number of bins is the number of data points or 256, whichever is fewer.
When the Logarithmic scaling option is selected in the Data section, the histogram bins are calculated from the log of the data values. This ensures the histogram remains aligned with the colormap when Logarithmic scaling is selected. This scales the X axis (bins).
You can also logarithmically scale the Y axis (frequency) values. This option is useful when only a few bins contain most of the data values. Logarithmic scaling the Y axis will show more detail in the histogram. To apply logarithmic scaling to the Y axis, right-click either of the data histograms and select Logarithmic Scale in the context menu. To return to linear scaling on the Y axis, right-click either of the data histograms and select Linear Scale.
In the Color Mapping section, the colormap anchor nodes are displayed above the data histogram. An anchor node's horizontal position corresponds to its Data Value and Position.
Colormap Example
The sample of the generated colormap is displayed directly below the histogram and anchor nodes.
Anchor Nodes
Anchor nodes are displayed directly above the data histogram. Anchor nodes specify a color and position in the Color Mapping section. Anchor nodes specify an opacity and position in the Opacity Mapping section.
You can add additional anchor nodes at any position along the colormap. To create a new anchor node, double-click on the data histogram where you want the new node added. In the Color Mapping section, the new anchor is automatically assigned a Color based on the previous colormap, and the Data Value is assigned based on where you clicked. In the Opacity Mapping section the new anchor is assigned the Opacity and Data Value corresponding to the exact location you clicked. You can add as many anchor nodes as you want. This lets you blend colors and opacities in many different ways on the colormap.
Left-click on an anchor node and press the DELETE key on the keyboard to delete a node. The first (far left) and last (far right) anchor nodes cannot be deleted.
Scroll Control
The scroll control appears as a horizontal bar with end handles. Drag a handle left or right to zoom the colormap and histogram in or out. Drag the center section to scroll the visible portion left or right. Double-click the center section to return it to the fully visible state. The scroll control changes the view of both the Color Mapping and Opacity Mapping sections.
|
|
|
Use the scroll control to zoom the colormap in or out. |

Opacity Mapping
The Opacity Mapping section contains the opacity mapping controls. These controls specify how a range of data values are mapped to opacity in the final output. Note that opacity is the opposite of transparency (0.0 is completely transparent, 1.0 is completely opaque).
Presets
The options in the Presets list may be used to preset the opacity settings which can then be modified as desired.
-
Fixed 100% sets the entire data range to a fixed opacity of 100% (fully opaque).
-
Fixed 20% sets the entire range of data to a fixed opacity of 20%.
-
Ramp 0 to 100% sets the data Min value to an opacity of 0% and the data Max value to an opacity of 100%. The opacity increases linearly from 0% to 100% throughout the data range.
-
Ramp 0 to 20% sets the data Min value to an opacity of 0% and the data Max value to an opacity of 20%. The opacity increases linearly from 0% to 20% throughout the data range.
-
Middle Ramp sets the lowest (fourth) quartile to 0% opacity, followed by a linear ramp over the third and second quartiles, followed by a fixed opacity of 100% for the greatest (first) quartile.
-
Custom is displayed automatically when a node is selected, created, removed, or the Opacity value or Data Value options are adjusted.
Data Value
The Data Value displays the data value of the selected node. The Position field displays the node's relative position in the colormap where the colormap minimum Position is 0% and the maximum is 100%. The selected node may be accurately repositioned by entering a new value in the Data Value or percentage in the Position field. The first and last nodes cannot be changed and this control is disabled when an end node is selected. To change the first and last nodes, change the Min and Max values in the Data section.
Level Ends
Check the Level Ends box to level the first and last segments of the opacity graph. When the nodes at one end of a level segment are dragged up or down, the other end is also dragged.
Opacity
Specify the opacity for the selected node in the Opacity
field. The Opacity value ranges
from 0.00% (completely transparent) to 100.00% (completely opaque). To
change the opacity, click on one of the nodes. Then, highlight the existing
value and type a new value or click the ![]() button to
increase or decrease the opacity for the selected node.
button to
increase or decrease the opacity for the selected node.
Data Histogram
The Opacity Mapping section includes a data histogram. See the Color Mapping section above for the histogram description. Opacity anchor nodes are displayed on the data histogram. An anchor node's vertical position corresponds to its Opacity. An anchor node's horizontal position corresponds to its Data Value and Position.
Data
The Data section contains options for setting the minimum and maximum data values and scaling to use in the colormap.
Use Data Limits
Check the Use data limits check box to use the data minimum and maximum values. This option is not available for classed post maps.
Colormap Data Minimum and Maximum
If you would prefer to set the colormap minimum and maximum values, enter the new numbers into the Min and Max boxes. This is useful when you are mapping different data sets in a similar range and would like to have the same data values represented by the same colors in each map. If a data value within the map falls outside this range, it is assigned the minimum or maximum color, whichever is closest.
The minimum and maximum values cannot be set for the classed post map. For the classed post map, the far left Min node is always the median value for the first class. The far right Max node is always the median value for the last class. This cannot be changed.
Logarithmic Scaling
Check the box next to the Logarithmic scaling to set the intervals between the nodes to a log(10) scale. The Min and Max values are the same. The nodes between the minimum and maximum and the color definitions adjust to fit the log(10) scale. On a log(10) scale, there is as much distance on the colormap sample between 1 and 10 as between 10 and 100 or 100 and 1000. In the example below, the nodes are displayed at 0.1, 1, 10, 100, and 1000. To use a regular linear scale on the colormap, clear the box next to Logarithmic scaling.
Loading a Colormap
The Load button opens an existing colormap .CLR file. When you click the Load button, the Open dialog is displayed with a list of colormap files. Click the file you want to use and click Open. The colormap is updated to show the colormap file settings.
Colormap files can be used with maps of varying Z ranges since the anchor nodes are stored as percentages rather than as data values. To use the exact same colors in the exact same data locations when the Z ranges vary slightly, override the default data limits and assign custom values in the Data to Color Mapping group.
Saving a Colormap
Click the Save button in the Colormap Editor to create a colormap .CLR file based on the current colormap settings. When you click the Save button, the Save As dialog is displayed. Type the File name for the colormap file and click Save. The file is saved for use with other files.