Changing Line Plot to a Scatter Plot
- Tutorial
Line, scatter, and line/scatter plots can be created directly from the ribbon. For example, if the Home | New Graph | Line/Scatter | Scatter Plot command had been clicked in Lesson 2, a scatter plot would have been created. Any line plot can be changed to a scatter plot or a scatter plot to a line plot by changing the plot properties. A different method for converting a line plot to a scatter plot is discussed in Lesson 5. The method discussed here allows other properties to be changed, if desired.
To change the line plot to a scatter plot:
- Make sure the plot created in Lesson 2 is open or recreate that graph by click the Home | New Graph | Line/Scatter | Line Plot command and selecting the Tutorial.dat sample file.
- In the Object Manager, select Site_A.
- In the Property Manager, click the Symbol tab to edit the symbol properties.
- Set the Frequency property in the Plot Symbol Properties section to 1. The plot is updated with the default symbol at every data value.
- The Symbol property displays the current symbol style. Click the current symbol, which by default is a
 . Clicking the current symbol opens the symbol palette. Click the filled square, symbol Number 10, two boxes to the left of the default symbol. Once you click on the filled square, the symbol palette closes and the plot automatically updates to show the new symbol.
 - Click on the Line tab to edit the line properties.
- In the Plot Line Properties section, click the current line style next to the Style property, to open the line style palette. Select the Invisible line style, which is the first entry in the line palette list. Once you click on the Invisible line style, the line style palette closes and the plot changes to a scatter plot.
|
|
|
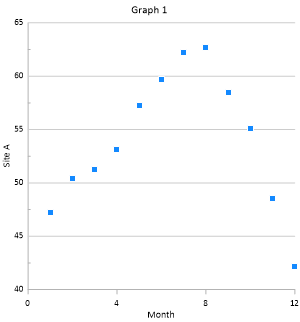
A scatter plot is created by adding symbols and changing the line style to Invisible. |
Back to Changing the Line/Scatter Plot Properties
Next to Displaying Plot Labels