Displaying Plot Labels
Labels can be displayed at any data point on the plot. Labels can come from the X or Y data columns or from any other data column in the worksheet. To display labels for the data points:
-
Click Site_B in the Object Manager to select the plot.
-
In the Property Manager, click on the Labels tab to display the plot labels properties.
-
In the Label variable property, select Column C: Site B from the list.
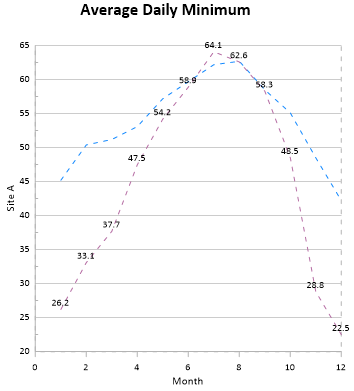
The Y data values from column B are shown as data point labels on the plot.
|
|
Add plot labels to show values or distinguish between data points. |
Back to Changing the Plot Type
Next to Moving Labels