Lesson 2 - Creating a Graph
You can create graphs in several ways in Grapher. Graphs can be created with
the graph wizard, from the Home | New Graph commands, from
the worksheet, and from templates.
To create a line plot graph:
-
If the worksheet window is still open, click the Plot1 tab. Alternatively, you can create a new plot window by clicking the File | New | Plot command.
-
Click the Home | New Graph | Line/Scatter | Line Plot command.
-
In the Open Worksheet dialog, select the Tutorial.xlsx file you saved in Lesson 1. You can select the file in the file list section or in the Open worksheets section at the bottom of the dialog. You can open the Tutorial.dat sample file if you did not complete Lesson 1.
-
Once the file is selected, click the Open button.
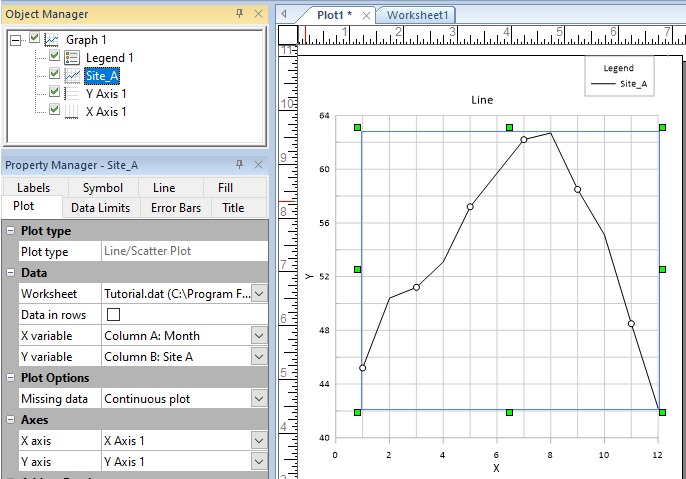
A line plot is created using the default properties. By default, Grapher uses the first two columns containing numeric or date/time data in the data file. In this example, the X values are in column A and the Y values are in column B. Depending on how you have Grapher configured, you will see the line plot window, the Object Manager, and the Property Manager. Those two windows are described in more detail throughout the tutorial.
|
| The line plot is created with the default settings. |
Back to Saving a Data File