Fit Statistics
Most fit statistics include the following information. The information in the << >> text is the name that should be used when linked text is desired.
Fit Name
The fit name can be changed through the Object Manager or by right-clicking on the selected fit then choosing Rename Object from the menu. Use <<FitName>> to link the fit name in the text.
Data Source Plot
The data source plot is listed in the fit Plot page. The data source plot is the plot to which the fit is applied. Use <<SourcePlot>> to link the data source plot name in the text.
Fit Equation
If a fit has an equation it is displayed in the fit statistics. See Available Fits for more details. Use <<Equation>> to link the fit equation in the text.
Alternate Equation
Alternate equations are provided for power and exponential fits. See Available Fits for more details. Use <<AltEquation>> to link the alternate fit equation in the text. When the equation has no alternate, the text No alternate equation is shown.
Number of Data Points Used
This section displays the number of data points used in the fit calculation. Use <<NumberOfPts>> to link the number of points used in the text.
Average X
Average X is displayed for most fits. Some fits display the average natural log of X (lnX). Use <<AvgX>> to link the average X value to the text.
Average Y
Average Y is displayed for most fits. Some fits display the average natural log of Y (lnY). Use <<AvgY>> to link the average Y value to the text.
Residual Sum of Squares
The residual sum of squares (SSe) is the sum of the squares of all the residual values. A residual is the difference between the fit Y values and the actual Y data values at given X values for linear fits. For non-linear fit equations, a residual is the difference between the linearized Y data values at given X values. Use <<RSS>> to link the residual sum of squares to the text.
Regression Sum of Squares
The regression sum of squares (SSr) is the sum of the squares of the difference between the average of all Y values and the fit Y value at each X location where a data point occurs for linear fits. For non-linear fit equations, the regression sum of squares (SSr) is the sum of the squares of the difference between the average of all linearized Y data values and the linearized Y fit value at each X location where a data point occurs. Use <<RGSS>> to link the regression sum of squares to the text.
Coefficient of Determination
Coefficient of determination, R-squared shows how well the data are explained by the best-fit line.
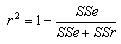
When using a Through origin fit, R-squared is calculated with

where Syy is the sum of y * y.
Use <<R2>> to link the R-squared value to the text. When multiple degrees to a polynomial fit are specified, use <<R2_n>> where n goes from 0 to the degree of the polynomial fit.
Correlation Coefficient
The correlation coefficient, R, shows the strength and direction of the linear relationship between to variables.
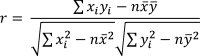
The correlation coefficient is also the square root of the coefficient of determination, R-squared.
Use <<R>> to link the R value to the text. When multiple degrees to a polynomial fit are specified, use <<R_n>> where n goes from 0 to the degree of the polynomial fit.
Residual Mean Square
The residual mean square, sigma-hat-sq’d equation is:

where n = the number of Y values for the curve on which the fit is based.
Use <<RMS>> to link the residual mean square value to the text.
P-Value
The P-value is the probability of finding the observed results when the null hypothesis is true. For the regression methods, the P-value tests the null hypothesis that the coefficient is equal to zero. In Grapher, the P-value is calculated using the Student's t test.
Use <<PValue>> to link the P-Value to the text.
Standard Deviation
The standard deviation is calculated for the normal distribution (Gaussian) fit. The normal distribution (Gaussian) fit is an option for the 2D Histogram and 3D XYY Histogram plots. The standard deviation of a sample is the square root of the variance of the sample.

where
|
n is the number of observations |
xi is the data value |
|
 is the mean
Use <<SD>> to link the standard deviation to the text.
Coefficients
The coefficients for each fit are displayed in the fit equation.
Standard Error of Coefficients
The standard deviation of an estimate is the standard error. The standard error of the coefficient is a measure of the precision of the estimate. The standard error of the intercept (A) estimate is displayed as the Standard error of intercept (A), and the standard error of the slope (B) estimate is displayed as the Standard error of slope (B) in the fit statistics. Use <<StdErrorX>> to link the standard error of the intercept to the text. Use <<StdErrorY>> to link the standard error of the slope to the text.
Orthogonal Polynomial Factors
Orthogonal polynomial regression statistics include X Shift, Y Shift, B[n], Alpha[n], and Beta[n]. Please see Orthogonal Polynomial Regression for more details on the use of these factors.
Use <<PolyDegree>>, <<XShift>>, <<YShift>>, <<B_n>>, <Alpha_n>>, <<Beta_n>> to link these values to the text. Where n is indicated, use the value between 0 and the largest polynomial degree.
Histogram Fit Statistics
Histogram fit curves display shape parameters, scale parameters, and location parameters. Different fit types have different parameters listed. Refer to the Available Fits page for the equations used for each fit type and which parameter is the shape, scale, or location parameter.
Use the above options to display the same information for histograms. In addition, use <<COEFF_0>>, <<COEFF_1>>, <<COEFF_2>>, for the Scale, Shape, Location, and Goodness of fit parameters.
Histograms also have a Goodness of Fit statistic. This value shows how likely the selected distribution type fits the data. Grapher uses an Anderson-Darling method to calculate the Goodness of Fit statistic. The value calculated and displayed in the fit statistics should be compared to critical values for the data.
For further information about fit statistics, please refer to the references or refer to any statistics book.