Plot Page - Histogram Plots
The histogram plot properties Plot page contains the options to change the data file and axes; set data used in the plot; add a fit curve to the graph; and set bar properties. To view and edit histogram plot properties, click on the histogram plot in the plot window or Object Manager to select it. Then, click on the Plot tab in the Property Manager. The properties available will be specific to the type of plot.
Click one of the Plot page section names in the list below to read more information about the properties in those sections or follow this help topic sequentially to read about each property.
|
|
|
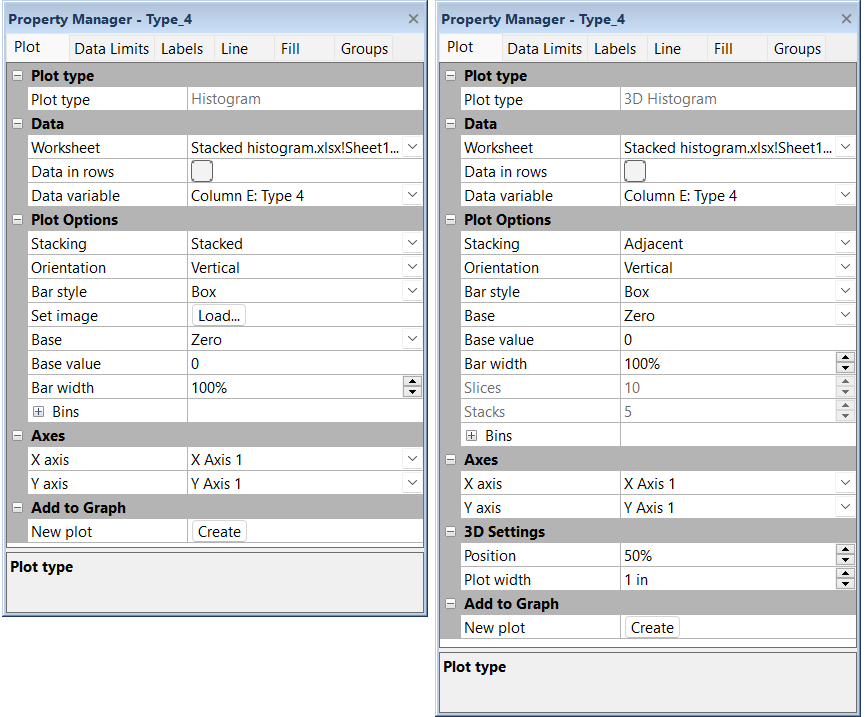
The histogram properties are edited in the Property Manager on the Plot page |
Plot Type
The Plot type property displays the type of plot.
Data
Worksheet
Click the existing data file path and file name next to Worksheet to select a different data file for the plot. Click on a currently open worksheet or click the Browse option to navigate to a worksheet that is not yet open. Select a different data file in the Open Worksheet dialog, and click the Open button to change the data. The plot automatically updates.
NOTE: The worksheet columns are retained after changing the worksheet. If any of the column options are blank after changing the Worksheet, click on the blank option and select the desired column. A blank next to column means that the column does not exist in the new worksheet.
Select the Data in rows option if your data file is formatted where each row includes one variable. When the Data in rows option is selected, all plot properties that require data values are specified by selecting a data row. This includes variables such as X and Y, data labels, worksheet ranges, etc. Properties that list column letters will update to list row numbers. When switching from plotting data in columns to plotting data in rows, Grapher may not be able to select the correct rows automatically. Verify the correct rows are selected.
The property descriptions below refer to data columns, but when Data in rows is selected the property lists will include rows.
Variables
Click on the column name next to the Data variable field to change the columns used to create the plot. In the list that appears, select the new column. If the first worksheet row contains header information, the header information appears next to the column letter.
Aside from the columns containing data there are two other options, row number and sequence number. These options are available in the list that appears before the first column.
-
Selecting the Row number option plots the axis with the row numbers used in the Worksheet rows section. For example, if the first row is number two, the axis begins at a value of two.
-
The Sequence number option plots the data according to the total number of rows used. The sequence number always begins with the number one regardless of which rows are selected in the Worksheet rows group. Blank lines between rows are ignored when calculating the value. The sequence number increments by one when rows are adjacent or when rows are skipped.
NOTE: The worksheet columns are retained after changing the worksheet. If any of the column options are blank after changing the Worksheet, click on the blank option and select the desired column. A blank next to column means that the column does not exist in the new worksheet.
Plot Options
The Plot Options properties group includes the main display options for the histogram. Multiple histograms can be displayed in a single graph as a plot group. The following properties are shared among all histograms in a single group: Stacking, Orientation, Base, Base value, Bar width, and all Bins properties. When a shared property is changed for one histogram, all other histograms in the group are updated to the new value.
Stacking
Multiple histograms can be displayed in a single graph. The Stacking property specifies whether the histograms are displayed stacked on top of one another or adjacent to one another. Select Stacked to stack the histograms within each bin. Select Adjacent to display the histograms next to one another within each bin.
Use stacked histograms to indicate categories within a single distribution, for example present total precipitation per weather event by precipitation type (rain or snow) with stacked histograms. Use adjacent histograms to compare distributions, for example display the heights of males and heights of females within a sample group.
Orientation
Histograms can be displayed horizontally or vertically. The Orientation options let you change the orientation of the bars. The default setting is Vertical, which plots the height of the bars vertically. The Horizontal option rotates the bars by 90°, showing the height of the bars horizontally. This results in a histogram where the bars protrude horizontally from the vertical axis.
Bar Style
The Bar style option allows the histogram bars to be drawn as rectangles or as another shape. The options available are Box, Cone, Inverted cone, Diamond, Spindle, and Image. The bar chart automatically updates to the new style after it is selected.
To use an image as the bar style, select Image from the Bar style list. Click the Load button next to Set image to open the Set Image dialog. Select the image and click OK to use the selected image.
Base
In a he Base and Base value indicate the location on the plot where the histogram bars originate. The graph varies depending on the selected Base value. The Base of the bars can be set to the data minimum, to the data maximum, to zero, or to a custom value. The bars are drawn from the base value to the data point value. To change the Base value, click on the existing option next to the Base. Select a new option from the list. Setting the Base to Zero causes all bars to originate at the zero axis value. Positive data values are drawn upward and negative data values are drawn downward. The Data minimum option draws all bars from the data minimum to the data value. The Data maximum option draws all bars from the data maximum to the data value.
The Custom option draws all bars from the Base value to the data value. The bars are drawn upward or downward depending on the data values and the custom base number.
For example, if the Base is set to Zero and the Y data value is 1500, the bar is drawn from zero to 1500 on the Y axis. If the Base is set to Custom and the Base value is set to 5000, the bar is drawn from 5000 to 1500.
Bar Width
The Bar width field controls the width of the histogram bars. Set the width of the bars from 1 to 50000 percent. The default width is 100 percent. The 100 percent width is determined by the range of the X values. When the Bar width is set to 100 percent, the bars touch and cover 100 percent of the data range. When the Bar width is set to 50 percent, the bars cover 50 percent of the data range and there are gaps between the bars. When the width is set to a value greater than 100 percent the bars overlap.
Slices
In a 3D histogram, when the Bar style is set to an option other than Box, the Slices option becomes available. The Slices option controls the number of sides that the 3D shape has. With a Bar style set to Cylinder, the more Slices the object contains, the closer to a round cylinder the object will be displayed. The Slices option can be set to a whole number between 2 and 100. When the Slices is set to 2, the object appears as two dimensional. The line properties for the slice lines are set on the Line tab.
Stacks
In a 3D histogram, when the Bar style is set to an option other than Box, the Stacks option becomes available. The Stacks option controls the number horizontally stacked sections that the 3D shape has. The Stacks option can be set to a whole number between 2 and 100. The line properties for the stack lines are set on the Line tab.
Bins
The Bins section controls how
the values in the Data column
are grouped. This controls the height of the bars, because different binning
properties will result in different bars. To open the Bins
section, click on the ![]() next to Bins.
Data values are placed in bins where the value is greater than the bin
minimum and less than or equal to the bin maximum, i.e. bin minimum <
x <= bin maximum.
next to Bins.
Data values are placed in bins where the value is greater than the bin
minimum and less than or equal to the bin maximum, i.e. bin minimum <
x <= bin maximum.
|
|
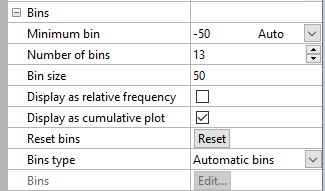
Minimum Bin
The Minimum bin controls the beginning X value for the first bin. To return the value to the automatically selected Minimum bin value, click the word Custom next to the value. Custom will automatically change to Auto and update the Minimum bin with the automatic value.
Grapher calculates the Minimum bin by subtracting the Bin size from the smallest data value. This way, only the minimum data value is always included in the first bin. Setting the Minimum bin value equal to the smallest data value will exclude the data from the histogram, since values that equal bin minimums are not included in the bin.
Number of Bins
The Number of bins is the number of bars displayed on the graph.
Bin Size
The Bin size controls the range of X values contained in each bar in the histogram.
The first bin includes values greater than the Minimum bin value. Each additional bin begins at slightly greater than the next bin value, which is calculated by adding the Minimum bin and the Bin size. All bins include the maximum value for that bin.
For example, if the Minimum bin is 0 and the Bin size is 10, the first bin includes the values greater than (but not equal to) 0 and less than or equal to 10. The next bin would include any values greater than 10 and less than or equal to 20. The third bin would include any values greater than 20 and less than or equal to 30.
Relative Frequency
To display data values as relative frequency rather than the total number of observations in a bin, check the box next to the Display as relative frequency command. When this box is not checked, bars display the total number of counts from the Data column in each bin.
Cumulative Histogram
To display the histogram as a cumulative histogram, check the box next to Display as cumulative plot. When checked, the value for each histogram bin is the sum of the values in the bin and all previous bins. When unchecked, each bin is summed separately.
|
|
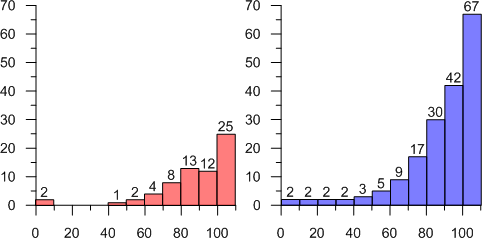
The histogram on the left shows the default histogram. Each bin is separate. The histogram on the right shows the cumulative histogram. Each bin value is the sum of the values in the bin and all previous bins. |
Reset Bins
Click the Reset button next to the Reset bins option to reset the automatic bins to the original default values. This changes the Minimum bin, Number of bins, and Bin size to the default values. This will cover all of the data in the Data variable.
Bins Type
Histogram bins can be automatic or custom. Automatic bins use the values in the Minimum bin, Number of bins, and Bin size options to determine the starting bin value, how many bars are displayed, and the bin size of each bar. To change the Bins type, click on the existing option. In the list, select the desired option.
Setting the Bins type to Automatic bins results in adjacent bars that cover all the data from the Minimum bin value to the last bin maximum value. For example, if the bin Minimum bin is 30, the Number of bins is 7, and the Bin size is 10, there are 7 bins: 30 to 40, 40 to 50, 50 to 60,..., 90 to 100. The data in the bins are greater than the minimum bin values and less than or equal to the maximum bin values.
Setting the Bins type to Custom bins, allows the user to set the minimum and maximum value for each bar individually. To create custom bins, change the Bins type to Custom bins. Click the Edit button next to the Bins command to open the Custom Bins dialog where you can set the custom values. When using Custom bins, the first bin can have no minimum, and the last bin can have no maximum, if desired.
Custom Bins
To set the bin ranges individually select Custom bins from the Bins type list and then click the Edit button next to Bins to open the Custom Bins dialog. After setting the bin minimum and maximum values, click OK and the custom bins are displayed.
|
|
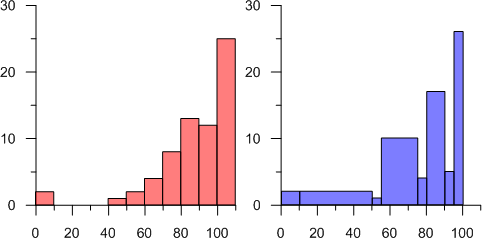
These two histograms display the same data. The histogram on the left uses automatic bins. The histogram on the right uses custom bins. |
Axes
Click on the axis name next to the X axis or Y axis fields to change the axes used for the plot. Select another axis name from the list. Alternatively, click Select plots/axis to change the axis used by several plots on a graph at once. See the Axis - Add to Graph help topic for information about how to add a new axis to the graph. Once the new axis is added to the graph, it will be available in the X axis or Y axis lists.
Add to Graph
Click the Create button next to the New plot command to create a new plot based on the current data file. A new plot is created using the same Data column as the selected plot. The line, fill, and/or symbol color automatically changes to a new color. The Plot palette option on the Options dialog Plots page controls the colors for plots added via the Create button in the Plot page.
3D Settings
Position
The Position option controls the location of the plot on the depth axis of the 3D plot. For example, 0 percent places the plot at the front of the graph, 100 percent places the plot at the back of the graph, and 50 percent places the plot in the middle of the graph.
Width
The Plot width controls the width of the plot. Plots can be 0.01 to 6 inches (0.025 and 15.24 cm) wide.
Fit Curve
Histograms are one of the plot types that can contain a fit curve. Click the Graph Tools | Add to Graph | Fit Curve command to add a fit curve. This allows a normal distribution (Gaussian), Lognormal distribution, Exponential distribution, Power distribution, or Inverse Gaussian distribution fit curve to be added to the histogram. A normal distribution is added by default. After adding a fit curve, edit its properties by clicking on the new fit object in the Object Manager to display its properties. See the Plot Page - Fit Plots help topic for more information.