Labels Properties
Data point labels can be shown on most plot types in Grapher. The labels can show data values or information from some other column in the data file. Labels can also be customized to appear in specific locations and can use a variety of formats, fonts, and colors to optimize the look and feel of the graph.
The following information is for all the options contained on the various Labels tabs. Not all options documented below apply to all labels for all plot types. To edit the labels, click on a plot to select it. In the Property Manager, click on the Labels tab.
|
|
|
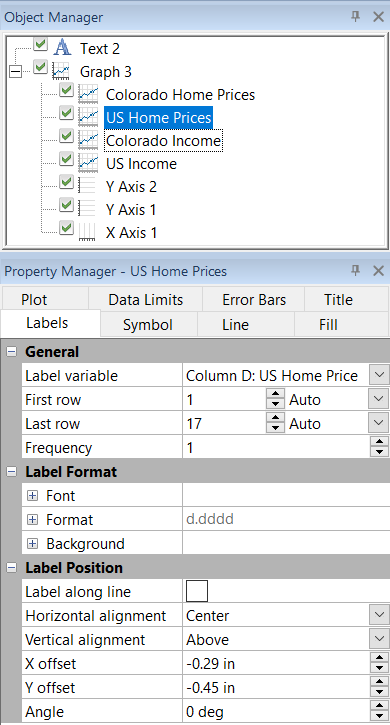
Set label properties in the Property Manager on the Labels tab. |
General
The General section includes the properties for specifying the column that contains the labels or the type of labels and how many labels should be displayed.
Label Column
Display labels on the plot by selecting the column that contains the labels. The column from which labels are added can be specified in the Label column list. Click None in the Label column field and select the desired column to display plot labels. The plot automatically updates to include the labels from the new column. Change the Label column to change which labels are displayed on the plot. Set the Label column to None to remove the labels from the plot.
When labels are plotted from a data column, you can include symbols in labels using Math Text commands in the worksheet.
Some plot types have more than one label column. For example, the vertical floating bar chart includes Start label column and End label column properties. In this case, you can plot labels at the tops of the bars, bottoms of the bars, or both. The labels can be the same, or they can be from different columns.
Floating Bar Label Columns
For a floating bar chart, there are two labels columns: Start label column and End label column for vertical floating bars or Left label column and Right label column for horizontal floating bars. You can display labels at either end of the floating bars or at both ends of the bars.
Stiff Plot Label Columns
For a stiff plot, there are Left column and Right column labels. The Left column displays labels on the left side of the stiff plot. The Right column displays labels on the right side of the stiff plot. To change the Left column or Right column, click on the existing column. In the list, select the new column. The plot automatically updates to include the labels from the new column.
Labels Type
Some plots use Label type properties to display plot labels rather than data columns. These plots include function plots and summation plots.
In function plots, you have the choice of displaying the X values or Y values as labels. Next to the Label type option, select Y values to display Y data values. Select X values from the Label type list to display Y values. Select None in the Label type list to remove the data labels.
In polar function plots, you have the choice of displaying the radius (R) values or angle (A) values. Next to the Label type option, select Radius values to display radius (R) data values. Select Angle values from the Label type list to display angle (A) values. Select None in the Label type list to remove the data labels.
In summation plots, you have the choice of displaying the X value or the cumulative Y value. Next to the Label type option, select Y values to display Y data values. Select X values from the Label type list to display Y values. Select None in the Label type list to remove the data labels.
Display Labels
Some plots use Display labels check boxes to display labels on the plot. The Display labels check boxes display data values or statistical information about the plot
For radar plots, select the Display labels check box to display the data values for the plot at each radar axis. Labels can be displayed or hidden for each radar plot individually.
For histograms, select Display labels to display the frequency for the bin as plot labels. The value is automatically updated to relative and/or cumulative frequency if the relative and/or cumulative frequency options are selected on the Plot page.
Worksheet Rows
You can choose the range of rows to plot labels in the Worksheet
rows group. Click the ![]() next to Worksheet rows to see the options.
The default rows are the first and last rows containing data.
next to Worksheet rows to see the options.
The default rows are the first and last rows containing data.
If Auto is selected for the First row and Last row, the first through last rows containing data are used as labels. To limit the range of the plotted labels, you can change the range of rows. Click on the word Auto and select Custom, and type a new row number value. To return to the default values, click the word Custom and select Auto. The First row or Last row will revert to the default rows.
Stiff Plot Label Rows
For a stiff plot, there are Left rows
and Right rows. Click the ![]() next to Left
rows or Right rows to
set the First row, Last row,
and Frequency.
next to Left
rows or Right rows to
set the First row, Last row,
and Frequency.
Frequency
Use the Frequency to control the number of labels in the plot. A Frequency of 1 displays a label for every data row. If the Frequency is set to 3, every third data point is labeled.
Label Format
The Label Format section includes the Font, Format, and Background properties for the plot labels.
Label Font
Click the ![]() next to Font to set the label
font properties. The font
Face, Size (points), Color, Opacity,
Bold, Italic, Underline, and Strikethrough properties can be set for most labels.
next to Font to set the label
font properties. The font
Face, Size (points), Color, Opacity,
Bold, Italic, Underline, and Strikethrough properties can be set for most labels.
Label Format
Click the ![]() next to Format to set the label format properties. The label
Type, display of numbers, Prefix, and
Suffix can be set for labels.
next to Format to set the label format properties. The label
Type, display of numbers, Prefix, and
Suffix can be set for labels.
Label Background
Click the ![]() next to Background to set the
label background properties. The Background
is the area behind the label. Click the
next to Background to set the
label background properties. The Background
is the area behind the label. Click the  next to Line
to set the line properties
for the line that goes around the text. Click the next to Fill
to set the fill properties
for the area around the text.
next to Line
to set the line properties
for the line that goes around the text. Click the next to Fill
to set the fill properties
for the area around the text.
Label Position
The Label Position section includes properties for defining the label position and rotation.
Label Position
Bar chart and histogram labels can be set to draw at the top or the bottom of the bars by setting the Label position option. Set the Label position to Start or End. To change the placement of the labels, click the existing option and select the desired option from the list.
Label Along Line
Checking Label along line to insert data labels parallel to the plot line. Clear Label along line to use the Angle property.
Horizontal Alignment
The labels can be positioned relative to the data point vertically, horizontally, and by specified amounts. Horizontal alignment controls the horizontal placement of the labels. You can position the labels to the Left or Right of the data point, Center the labels on the data point, or alternate the position of the labels to the left and right of neighboring data points (Alternate left-right). To change the horizontal placement of the labels, click the existing option and select the desired option from the list.
Vertical Alignment
Vertical alignment controls the vertical position of the data label. You can position the labels Above or Below the data point, Center the labels on the data point, or alternate the position of the labels above and below neighboring data points (Alternate above-below). To change the vertical placement of the labels, click the existing option and select the desired option from the list.
Z Alignment
The Z alignment is available for 3D XYY and 3D XYZ plots. Through the Z alignment setting, the plot labels may be drawn at the Front, Center, or Back of the 3D plot. To change the Z placement of the labels, click the existing option and select the desired option from the list.
Label Offset
When the Label along line box is checked, X offset changes to Offset along line. Depending on the plot type, labels can be offset from their position along the X and Y directions or along the radial and angular directions. Offsets are specified in page units.
X and Y Offset
Labels can be positioned at a custom position by entering values into the X offset or Y offset boxes. Entering a positive value into the offset box moves the label up for the Y offset or to the right for the X offset. Entering a negative value in the offset box moves the label down for the Y offset or to the left for the X offset.
When Label along line is checked, X offset is renamed to Offset along line.
Offset Along Line
The offset values are in page units. Entering a positive value moves the label to the right. Entering a negative value moves the label to the left.
Radius and Angle Offset
2D polar bar chart labels have a Radius offset and Angle offset instead of the X offset and Y offset.
The Radius offset moves the label closer or farther from the bar. Entering a positive value into the Radius offset box moves the label outward, away from the bar. Entering a negative value in the Radius offset box moves the label inward, into the bar. A value of zero positions the label at the end of the bar.
The Angle offset rotates the label around the angle axis. Entering a positive value into the Angle offset box moves the label in a clockwise direction from the bar. Entering a negative value in the Angle offset box moves the label in a counter-clockwise direction from the bar. A value of zero positions the label at the center of the bar. The Angle offset value is specified in degrees.
Angle
You can enter a number into the Angle box to rotate the data point labels. Positive values rotate the label in a counter-clockwise direction. The Angle is specified in degrees.
|
|
|
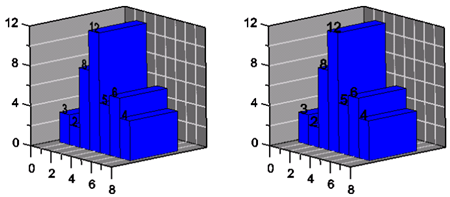
The graph on the left shows angled plot labels. Angled labels are parallel to the plot, not aligned with the screen. The graph on the right shows non-angled labels that are parallel to the screen. |
Label Leader Line
Label leader lines can be used to connect the text label to the data point. If the edge of the label is further than 0.1 inches (0.254 centimeters) away from the data point, label lines are displayed. This normally means that label lines are displayed if labels have been moved with the Move Labels command or if the X offset or Y offset values have been changed from zero. The line goes from the label to the point. Line properties can be changed for the label lines. To change the label line properties, change the properties in the Label Leader Line Properties section of the Line page.