Slices Properties
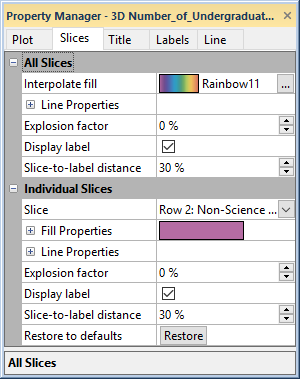
The pie chart properties Slices page contains the properties of each slice for a pie chart or doughnut plot. To view and edit pie chart properties, click on the pie chart in the plot window or Object Manager to select it. Then, click on the Plot tab in the Property Manager.
|
|
|
Set the properties for all slices or individual slices on the Slices page. |
All Slices Properties
The properties in the All Slices section affect all slices at once. Setting an All Slices property will overwrite previous changes made to the property in the Individual Slices section.
Interpolate Fill
Specify a color gradient to apply across the pie or doughnut slices
in the Interpolate fill property.
Select a predefined color gradient from the list, or click the  button to create a custom
Color Gradient.
Line Properties
Set the line properties for all slice lines in the Line Properties section.
Explosion Factor
You can move the slices out from the center of the pie chart or doughnut plot by entering a number into the Explosion factor box. For example, an explosion factor of 50 percent moves the slice(s) half the distance of the slice length from the center of the chart.
Display Labels
Check the box next to the Show label command to show or hide slice labels.
Slice-to-label Distance
Enter a new number into the Slice-to-label distance box to change the distance between the label and the slice. For example, a Slice-to-label distance of 50 percent places the label from the slice half the distance of the slice length.
Individual Slice Properties
The Individual Slices section includes the properties for each pie or doughnut chart slice. To edit an individual slice, select the slice in the Slice list.
The Individual Slices section includes the same properties as the All Slices section above, as well as Fill Properties for each slice.
To revert changes made to an individual slice, click Restore in the Restore to defaults field to use the properties from the All Slices section for the pie or doughnut slice.
