Angle Axes
Angle axes appear on polar-type plots. Angle axes are created when the polar type plots are created. Angle axes cannot be added to an existing graph.
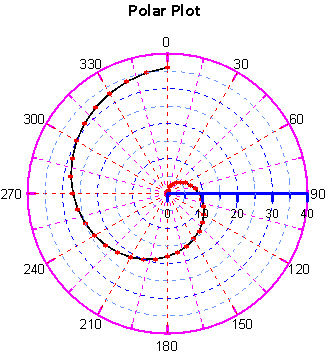
In this example, the Angle Axis is displayed in magenta.
The Radius Axis (Standard Axis) is displayed in blue.
Editing an Existing Angle Axis
To change the features of an angle axis, click once on the axis in either the plot window or the Object Manager to select it. The properties of the selected axis are displayed in the Property Manager.
Multiple axes can be selected and edited at once. To select multiple axes, click on the first axis to select it. Hold down the CTRL key and click on the second axis In the Object Manager.
Click the following tabs in the Property Manager to change different properties: